
 Home
Home News
News

- Litecoin price, after clearing the supply zone now moving towards the resistance of $230 and $245, while successfully started to trade above all major moving averages
- The pair of LTC/BTC is trading below all moving averages of 20,50,100 and 200-Day, standing at 0.003841 BTC with intraday gains of +4.19%
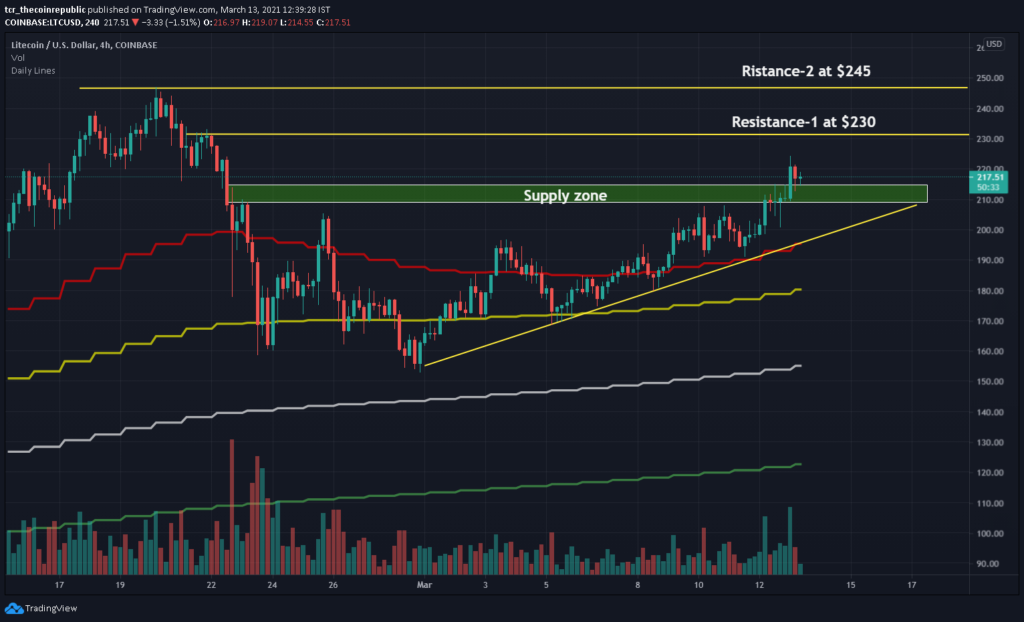
Litecoin price after a positive breakout is heading towards the minor resistance of $230 and $245; however, a retracement is observed after breakout where supply zone is acting at support zone. The coin is in a bullish trend over the weekly chart as trading with a rising support line and above the major moving averages of 20,50,100 and 200-Day. The support on the lower levels is placed at $185 and $160, while the higher side’s resistance is situated at $230 and $245. The volume also justifies the bullish momentum as the increment is observed.

Positive news for litecoin also supports the bullish momentum for upcoming trading sessions, which is Fungibility (say it 3 times real fast) is the necessary feature of any currency, as it makes it exchangeable, divisible into units, and capable of storing value.

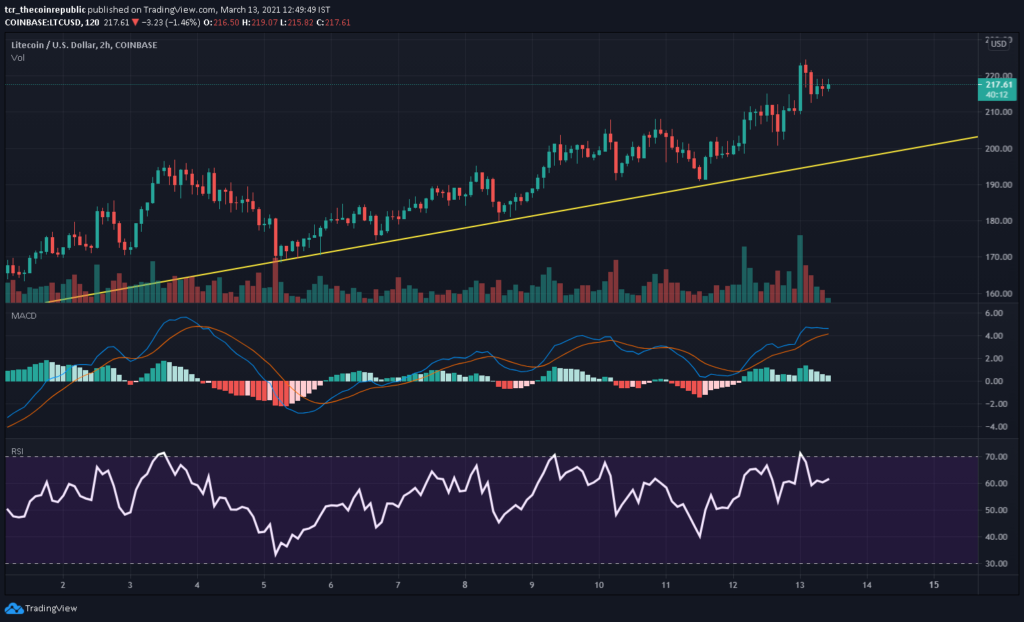
Litecoin price over the daily chart follows a strong uptrend, which is supported by the rising volume indicating the participation of buyers and sellers. The momentum is supported by the rising trend line, acting as a support line. The daily chart support is situated at $200 and $190. Meanwhile, the higher side’s resistance is placed at $225 and $238. LTC CMP at $218 with intraday gain of +4.42%, while the volume also jumped nearly +28.37% standing at $7,438,721,611. Likewise total market capitalization stands at $14,571,775,546 with intraday increment of +4.44%.
Relative Strength Index (BULLISH) indicates bullish momentum while trading at 62.82. However, it is continuously heading towards the overbought zone after testing the overbought zone indicating its bullish trend on a shorter-term time frame.
Moving Average Convergence Divergence (BULLISH) currently indicates a bullish trend on the daily chart, as it is trading with the significance of the buyer’s signal line (green) over the seller’s line (red). However, both lines are heading closer to each other, and the crossover can generate bearish momentum for the short term, but the overall trend is still positive.
Support levels: $185 and $160
Resistance levels: $230 and $245.
Mr. Pratik chadhokar is an Indian Forex, Cryptocurrencies and Financial Market Advisor and analyst with a background in IT and Financial market Strategist. He specialises in market strategies and technical analysis and has spent over a year as a financial markets contributor and observer. He possesses strong technical analytical skills and is well known for his entertaining and informative analysis of the Financial markets.


