
 Home
Home News
News

- Vechain price created its new all-time high of $0.071 with the help of the rising channel pattern and gained nearly +45% in the last seven days
- The pair of VET/BTC is placed above the major moving averages of 20,50,100 and 200-Day CAM at 0.000001226 BTC with an intraday gain of +10.54%
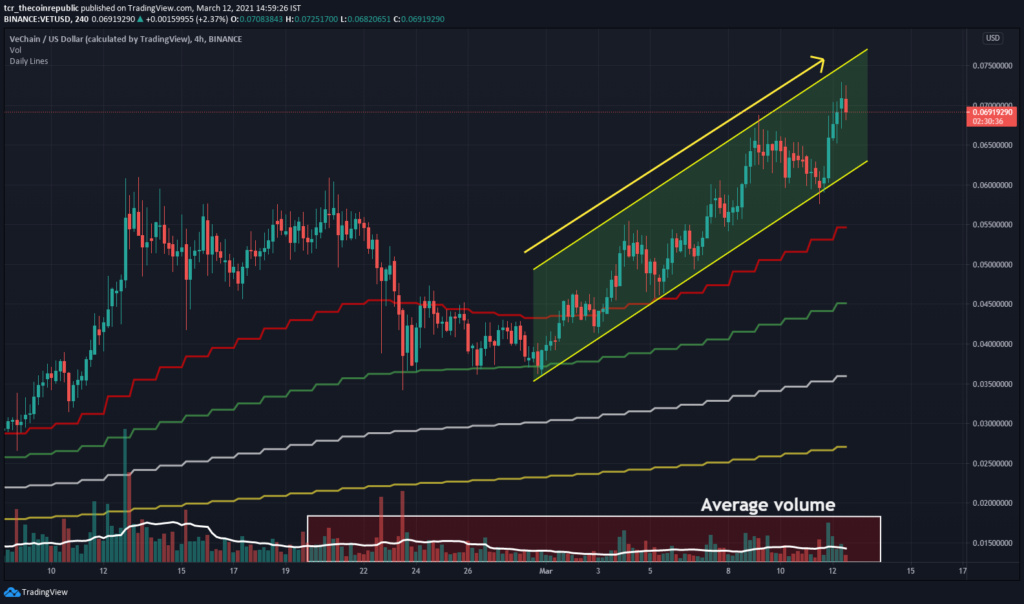
Vechain price created a bullish chart pattern that created higher highs and lower bottom patterns, followed by the rising channel pattern. VET is currently trading above all moving averages of 20,50,100 and 200-Day, which indicates its bullish momentum. However, the major thing is consolidated volume, as it is not supportive of the bullish momentum, and it is recorded below its average. The higher side’s resistance is placed at $0.071, and $0.080 can be considered a major psychological hurdle, while on the lower side, support is situated at $0.047 and $0.035.

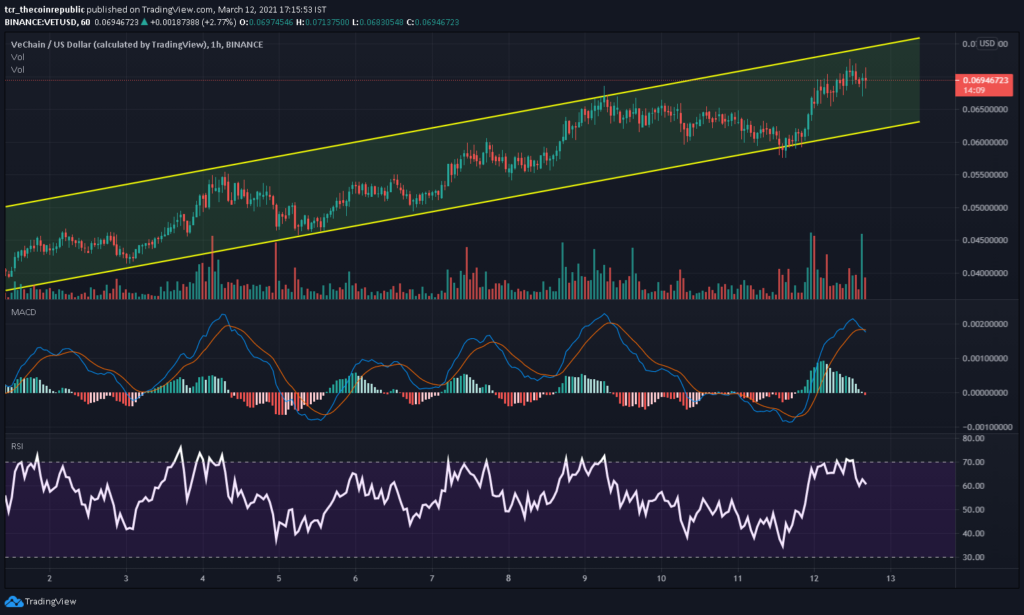
Vechain price over the daily chart also follows the rising channel pattern while increasing bullish momentum. The coin is currently trading at $0.069 with an intraday jump of +15.63%, while the total market capitalization stands at $4,443,072,838 with an intraday increment of +14.27%. Over the volume part which jumped nearly +71.36% standing at $1,043,999,580. Support on the lower side is placed at $0.062 and $0.057. Meanwhile, the resistance is situated at $0.072 and $0.076.

Relative Strength Index (BEARISH) indicates bearish momentum while trading at 51.52. However, it is continuously heading towards the oversold zone after testing the overbought zone indicating its bearish trend on a shorter-term time frame.
Moving Average Convergence Divergence (BEARISH) currently indicates a Bearish trend on the daily chart, as it is trading with the significance of the seller’s signal line (red) and the buyer’s line (green). However, both lines are not giving any sign of recovery for upcoming trading sessions.
Support levels: $0.047 and $0.035.
Resistance levels: $0.071 and $0.080
Mr. Pratik chadhokar is an Indian Forex, Cryptocurrencies and Financial Market Advisor and analyst with a background in IT and Financial market Strategist. He specialises in market strategies and technical analysis and has spent over a year as a financial markets contributor and observer. He possesses strong technical analytical skills and is well known for his entertaining and informative analysis of the Financial markets.


