
 Home
Home News
News

- Polkadot price is forming a pennant like structure on the line chart, indicating a possible 34% rally upside
- Polkadot volume shows a marginal upper hand of buyers over sellers
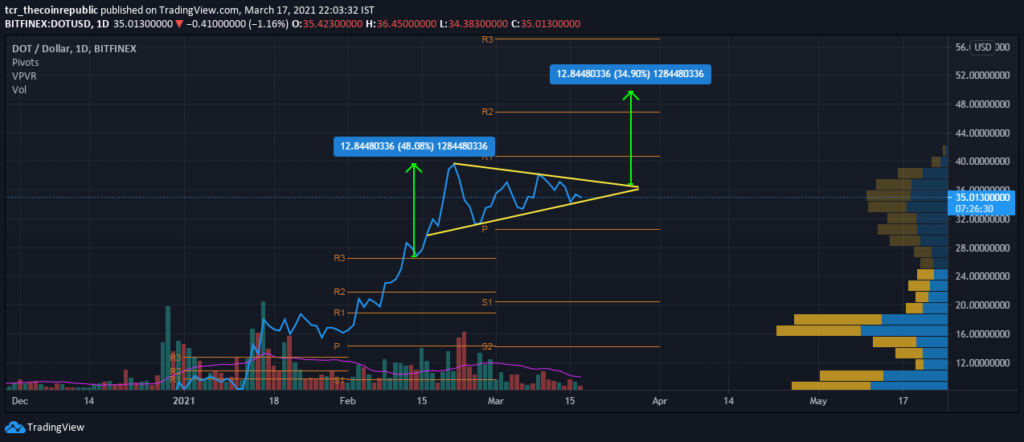
Polkadot price forms a pennant-like structure on the line chart, which formed due to consolidation between pivots at $40 and $30 levels. The volume analysis of the coin is pointing towards the end of the current trend as the volumes have vanished, while the price range volume shows a higher number of buyers of sellers. The market cap and 24-hour volumes are $30,855,209,721 and $719,447,820 respectively.

Polkadot Price: Indicators Narrating A Different Story
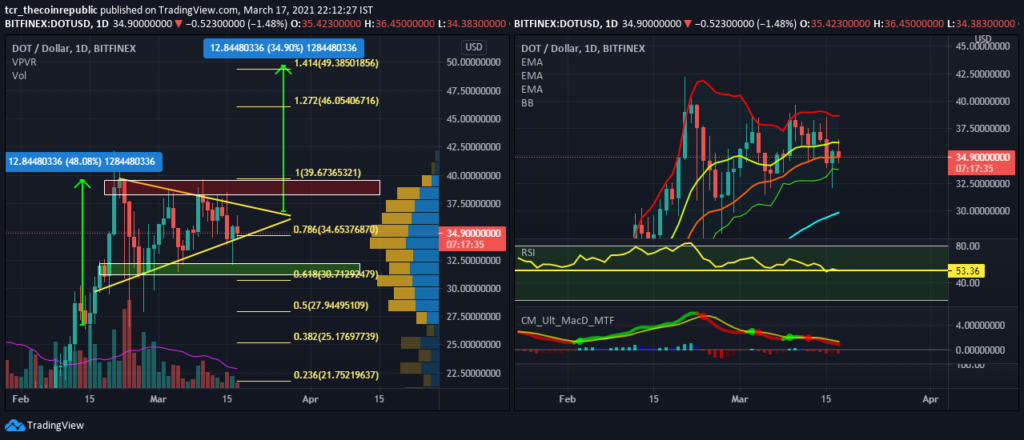
Left Image: Price analysis shows Polkadot price faces heavy buying in $32-$33 zones while heavy selling in $38-$39. Apart from this, crucial Fibonacci levels are $30.7, $34.65 and $39.67. Confirmation of direction can only be confirmed through a breach of $30 or $39 levels.

Right Image: The price is resting at 20-EMA($34.87) but facing resistance from 10-EMA($36.2). Strong support is expected from 50-EMA and 200-_EMA at $30 and $12.
Contraction of Bollinger Band indicates a de-escalation in volatility which often results in either side volatile movements. The bands have restricted the price between $33.75 and $38.66, while the median restricts the price from surging above $36.2.
RSI is at 53 levels and is still declining, suggesting the possibility of further decline in strength. 50-levels is crucial for the indicator; any decline below will probably initiate a bear run.
The MACD(8,21,5) is also crawling towards 0-levels, suggesting a loss of momentum in the price. A rise in the volatility of MACdD will indicate strong strength for a new bear or bull rally.
Conclusion:
Polkadot price is forming a pennant pattern that is on the verge of getting broken. The direction of the new rally is still unknown, as, in one place, the volume shows a higher buying volume while on the other, the indicators are declining towards neutral levels, indicating a loss of momentum.
Support: $34.65, $32-$33 and $30
Resistance: $38-$39, $40 and $42


