
 Home
Home News
News

- OMG price Near Resistance of the symmetrical triangle, bulls attempting to break out from the structure
- The price of OMG may surge up to previous high of $8.00 i.e., 34% upside
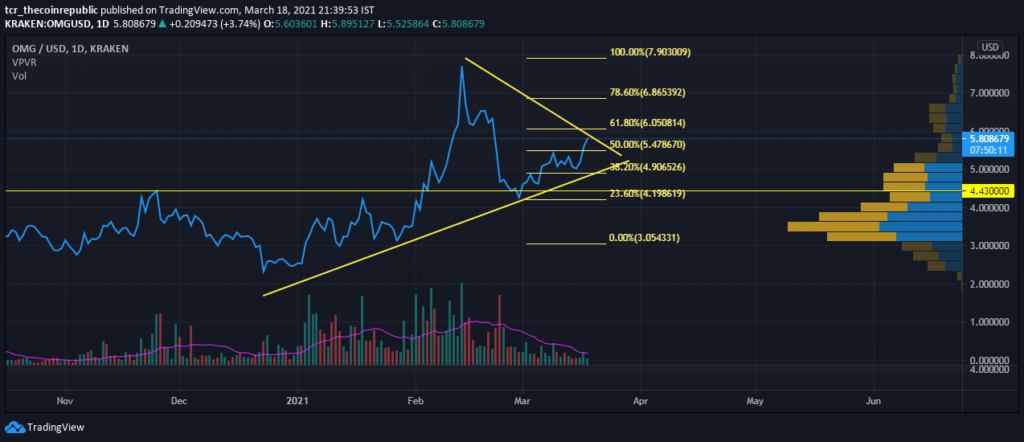
OMG price has received a fresh buying force that carried the price from the support to the symmetrical triangle’s resistance. The rally has halted because of the resistance since the volume shows a lack of participation from the bulls. The price range volume also shows fewer volumes at the current range, dominated by buyers. A breach from the triangle may bring in more bulls and carry the price further. The market cap and 24-hour volume are $821,550,245 and $498,289,339 respectively.

Bollinger Band Indicates A Probable Breakout Of OMG Price
Left Image: OMG price has reached the symmetrical triangle’s resistance after a small rally of 10%. So far, the candles formed in the current and last sessions are full-bodied, indicating a strong buying pressure. The price is currently facing resistance from the diagonal resistance and 61% Fibonacci levels at $6.05. Other crucial levels are $4.2, $4.9, $6.05, $6.86 and $7.9.

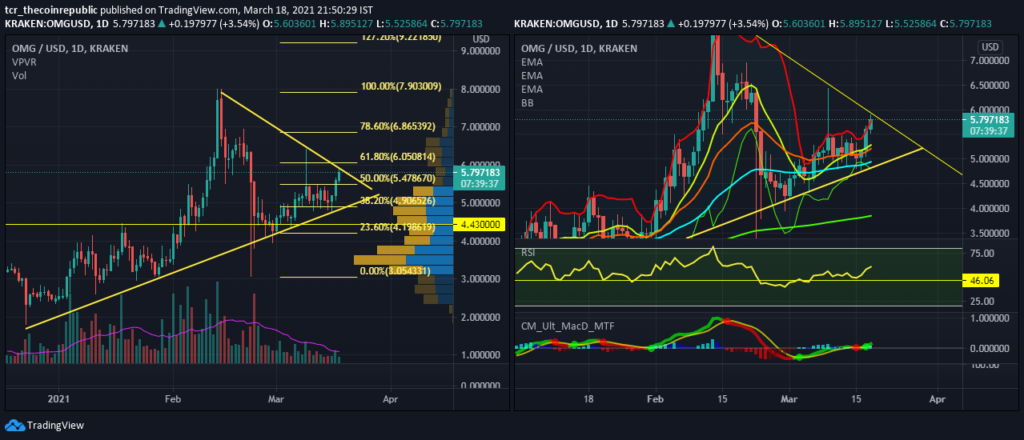
Right Image: The price of the coin is hovering above all the EMAs: 10-EMA($5.28), 20-EMA($5.21), 50-EMA($4.95), and 200-EMA($3.85). Such formation indicates a bullish momentum, especially when the 10-EMA and 20-EMA give a bullish crossover.
The Bollinger Bands have widened up, indicating a rise in volatility. However, the price faces resistance from the upper band at $5.76, which could be a hurdle for the barrier. The lower band and median(10-EMA) are supports at $4.8 and $5.28, respectively.
RSI is hovering at 58 levels and is likely to face resistance at 70 and 80 levels. Hence the price has scope for breaking out of the triangle. The support for the indicator is at 50.
MACD(8,21,5) has signaled the bulls to enter, a factor that could bring in fresh buying from here on. The MACD is at 0 levels, and its previous top was at 1.00 levels. Hence a strong rally may emerge from hereon.
Conclusion:
OMG price has recently seen a fresh set of buyers, but the volumes remain low, which remains a hurdle for the breakout. Above all EMAs, the price is facing resistance from the upper Bollinger band. Momentum oscillators are neutral-to-bullish. Hence there is a scope of a strong rally from here on.
Support: $5.47-$5.5, $4.9, $4.2 and $3
Resistance: $6.05, $6.86 and $7.9


