
 Home
Home News
News

- Zcash price is consolidated between a symmetrical triangle, while volumes suggest termination of the current trend
- Zcash price likely to go volatile on either side: 20% upside or 10% downside
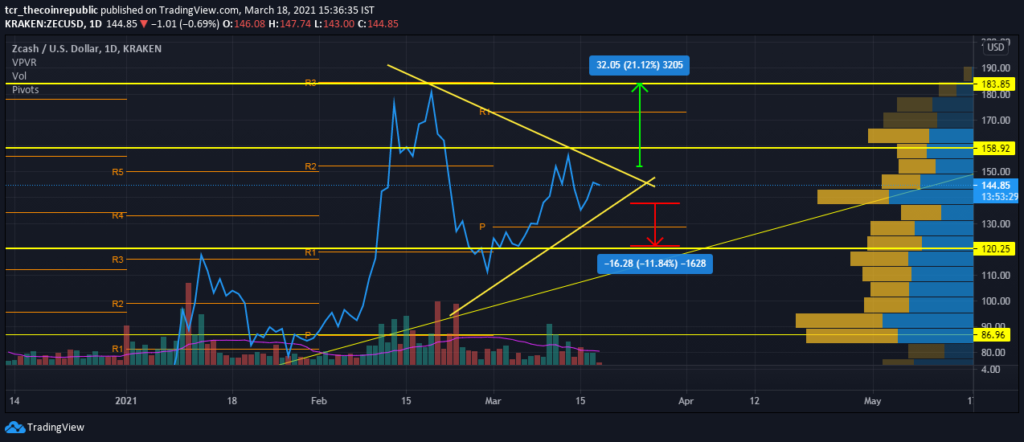
Zcash price is restricted within a symmetrical triangle pattern along with crucial resistances at $159, $173, and $183, while supports are present at $130, $120, and $110. The volume analysis shows indecisiveness as the volumes have vanished, but the price range indicates a higher buyer’s volume over seller’s volume, indicating a possible breakout. The market cap and 24-hour volumes are $1,643,854,037 and $434,732,267 respectively.

Zcash Price Action Formed A Morning Star Candlestick Pattern
Left Image: The price analysis shows that Zcash price action formed a morning star pattern after receiving fresh buying at the support of a symmetrical triangle. A successful morning star pattern candle initiates a strong bull rally often. Crucial Fibonacci levels are: $103, $120, $135, $148-$150, $168 and $193.

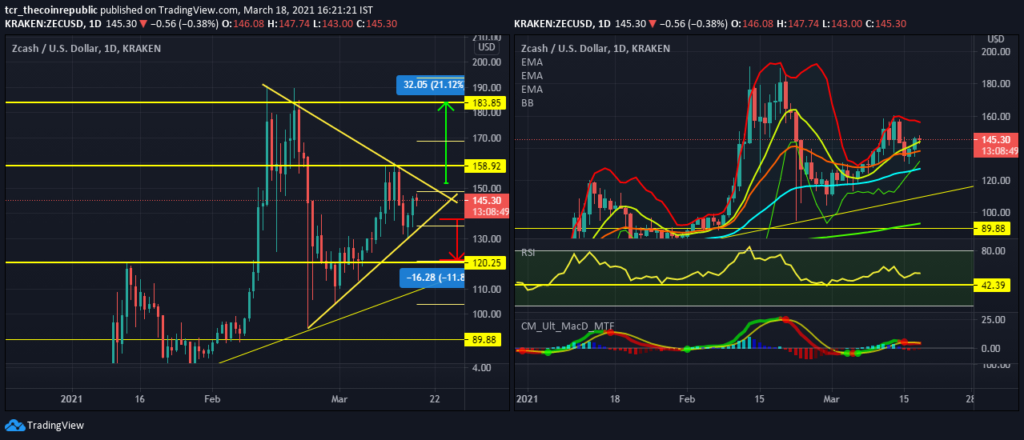
Right Image: In the daily time frame, the coin receives support from the 10-EMA($144), which is further backed by 20-EMA, 50-EMA, and 200-EMA at $138, $127.2, and $93. The 10-EMA and 20-EMA have given a bullish crossover, which can aid the price breach out of the triangle.
Bollinger Bands are still contracting, which is a sign of worry as the bands may hamper the breakout and stop the price from rising further. The upper band and lower bands are at $156 and $131. The Price is above the median – 10-EMA($144).
RSI is hovering at 55, which is bullish momentum for the coin, but it moves sideways, which is insufficient for breaking out of the triangle. Support for the indicator lies at 40-43 belts while resistance is 64-65 and 80.
MACD(8,21,5) flashed red signal for the sellers, which could bring in more selling; however, the price is rising so far, which means it could be a false signal, and the price may break out from the triangle.
Conclusion:
Zcash price was restricted within a symmetrical triangle pattern and attempted to give either side breakouts. Indicators for the coin are indecisive as the RSI is mildly bullish while MACD is bearish. Other than above, the coin also lacks volumes.
Support: $103, $121 and $135
Resistance: $148-$150, $168-$170 and $193-$195.


