
 Home
Home News
News

- 1inch broke out, currently consolidating. We might get a retest before it moves to test major resistance
- We should see rejection once it gets to $5.75 but eventually, we should see a breakout from this range
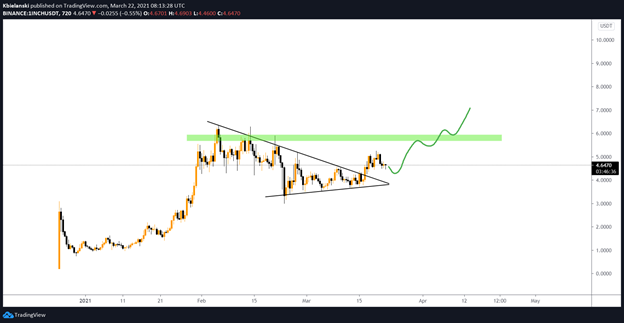
The 4-hour technical chart of 1inch projects an uptrend. According to pivot points, 1inch’s critical support level is placed at $3.90. Whereas if it moves up, the key resistance level to watch is $5.80. While diving into the weekly chart of a 4-hour time-frame, it completes a symmetrical triangle pattern and the price action gives a breakout from the pattern.

RSI indicator (BULLISH), with a value of 53, indicates a buy signal in the coin. Moreover, Investors can see an upward slope from 46 to 53 in the index, and it may surge more in future trading sessions.

Critical Pattern Suggests A Positive Breakout In 1inch Price
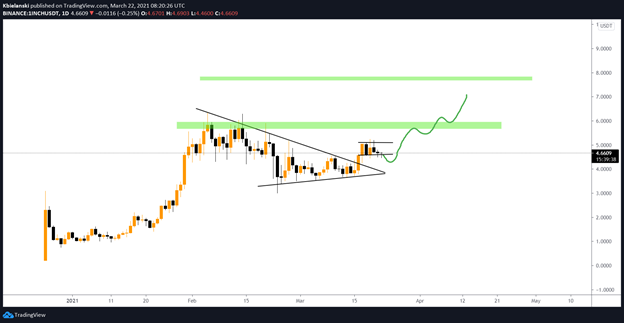
1inch price traded at $4.78 with a gain of 4.80% in the last 24-hour. Furthermore, 1inch broke out from a triangle pattern. In contrast, the market capitalization stands at $714 million. Technically, investors can perceive a positive breakout in 1inch’s price action. Moreover, if the price movement sustains above $5.80 our next target would be the resistance of $7.70.
Resistance: $5.80, $7.70
Support: $3.90


