
 Home
Home News
News
- ALGO price forecast an ascending triangle pattern on the daily chart
- The 24-hour volume in ALGO is at $275,204,792 with a 18.22% decrease
- The ALGO/BTC pair was trading at 0.00002049 BTC with a gain of 0.30%
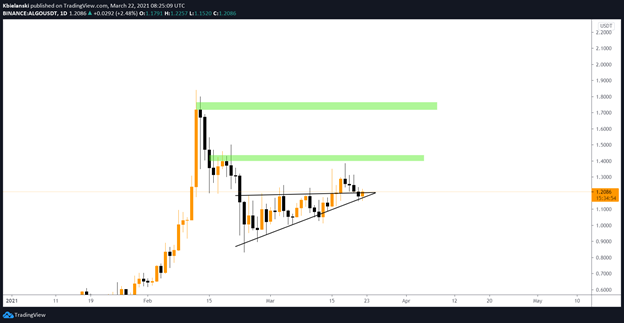
The 4-hour technical chart of ALGO price action forecasts an ascending triangle pattern. According to pivot points, ALGO’s critical support level is placed at the baseline of the triangle at $1.05. Whereas if it moves up, the key resistance levelslevel to watch are $1.42 and $1.82. While diving into the weekly chart of a 4-hour time-frame, it completes a spinning top candlestick pattern it means that neither sellers nor buyers could gain the upper hand.

ALGO Price had a good breakout above the ascending triangle pattern, however when it was testing previous support it couldn’t hold above it for a much longer time frame. Moreover, an increase in buying pressure may act as an important role in giving a breakout once again.

Algo will have another attempt to breakout soon. Price needs to stay above $1.22 to reach above mentioned targets.
ALGO Price Forecast Buying Volume Is Required
ALGO price traded at $1.16 with a gain of 4.50% in the last 24-hour and 6.30% down in the weekly time-frame. Furthermore, ALGO price needs to sustain above the mark of $1.22. In contrast, the market capitalization stands at $3.03 billion. Technically, investors can perceive the price is still inside the triangle pattern. Moreover, the price movement can be towards the resistance of $1.42 and $1.82.
Resistance: $1.42 and 1.82
Support: $1.05


