
 Home
Home News
News
- BNB price forecast downtrend from $293 to $246.10 on Thursday’s trading session
- The 24-hour volume in BNB is at $2,302,690,053 with a 7.74% increase
- The BNB/BTC pair was trading at 0.004641 BTC with a loss of 0.50%
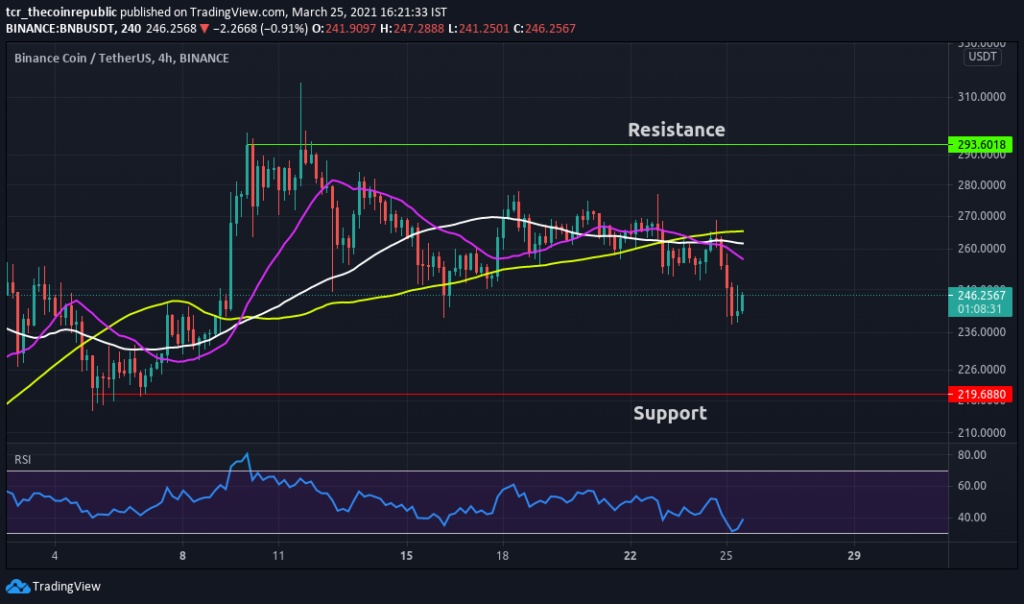
The 4-hour technical chart of Binance Coin price action forecasts a downtrend. According to pivot points, BNB’s critical support level is placed at $219.50. Whereas if it moves up, the key resistance level to watch is $293.60. While diving into the weekly chart of a 4-hour time-frame, it completes a bearish engulfing candlestick pattern which represents bears are in control.

SMA-20, 50 & 100 acts as another strong support in the coin. SMA-20 (purple) intersects below the SMA-50 (white), which projects a bearish trend. The price is also way below SMA-100 (yellow). Investors may perceive a negative crossover in the SMA, and the price will also follow the negative trend.

RSI indicator (BEARISH), with a value of 39.10, indicates a sell signal in the coin. Moreover, Investors can see an upward slope from 31 to 39 in the index which represents a minor pullback in the asset’s price, and it may soar in future trading sessions.
Binance Coin Price Forecast Bears Are Hunting
Binance Coin price traded at $246.10 with a loss of 6.40% in the last 24-hour and 10.84% down in the weekly time-frame. Furthermore, BNB plunges from the resistance of $293.60. In contrast, the market capitalization stands at $38 billion. Technically, investors can perceive a negative crossover in SMA. Moreover, the price movement can be towards the support of $219.50 and may give a pullback upto the resistance of $293.60.
Resistance: $293.60
Support: $219.50
Mr, Nikhil Ingole is a Chief Editor at The Coin Republic with over five years of technical analysis & trading experience in Forex and Crypto. As a commerce graduate, he has taken a keen interest in blockchain’s future potentials in the financial industry. A keen cryptocurrency enthusiast, he is very supportive of new media projects, pioneer ideas and the Bitcoin community. He possesses strong technical, analytical skills and is well known for his financial market’s informative analysis. Other than crypto, Nikhil Loves to watch his favorite football team and keep up to date with the latest Formula 1 racing.


