
 Home
Home News
News

- BAT coin price bounced back from $0.95 to $1.12 on Sunday’s trading session
- The 24-hour volume in BAT is at $440,778,947 with a 14.18% increase
- The BAT/BTC pair was trading at 0.00002028 BTC with a gain of 4.50%
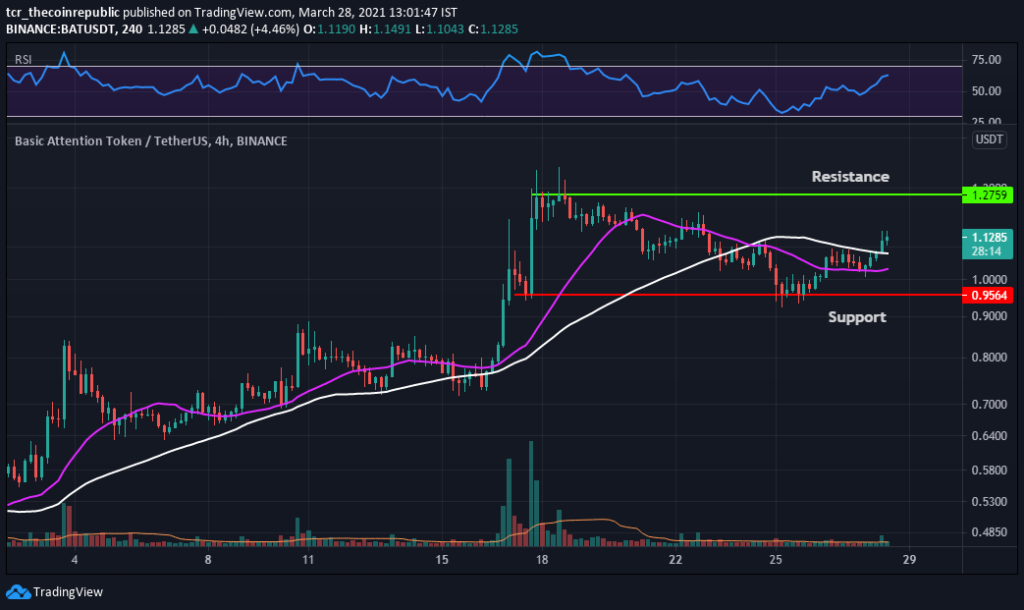
The 4-hour technical chart of BAT coin price action forecasts an uptrend. According to pivot points, BAT’s critical support level is placed at $0.95. Whereas if it moves up, the key resistance level to watch is $1.27. While diving into the weekly chart of a 4-hour time-frame, it completes an inverted hammer candlestick pattern representing bullish reversal with medium reliability.

SMA-21 & 50 acts as another strong support in the coin. SMA-20 (purple) is below the SMA-50 (white), which projects a bearish trend. The price has crossed above SMA-50 and the price may also follow the positive direction.

RSI indicator (BULLISH), with a value of 63.80, indicates a buy signal in the coin. Moreover, Investors can see an upward slope from 48 to 63 in the index, and it may surge in future trading sessions.
The volume of (5.733M) represents a moderate buying volume which is above the Volume MA (5.078M) of 20-days. High buying pressure is required in BAT to drive its price to higher levels.
Sudden Drop in Large Transaction of BAT Coin
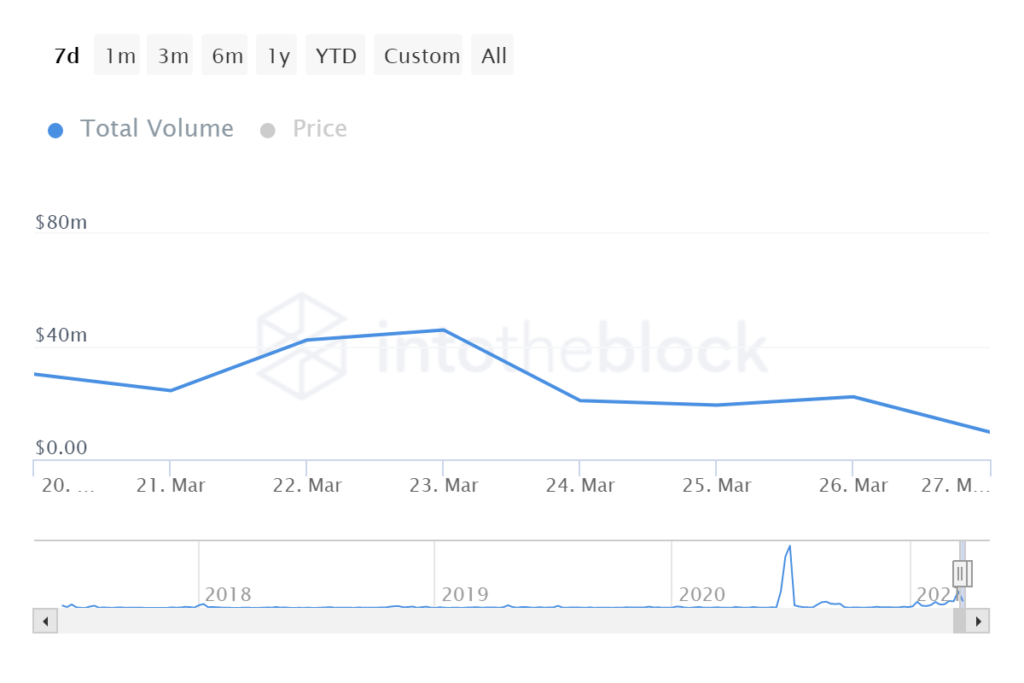
The weekly chart mentions large transactions and those onchain metrics where an amount larger than $100,000 USD was transferred. These act as a proxy to institutional players and whales activity, pointing to how they may be investing and situating in the asset. Investors can perceive a drop from March 23, which was $45.89M and on Mar 27, its $9.7M.
BAT Coin Price Action Projects Positive Movement
BAT coin price traded at $1.12 with a gain of 6.0% in the last 24-hour and 2.33% up in the weekly time-frame. Furthermore, BAT bounced back from the support of $0.95. In contrast, the market capitalization stands at $1.70 billion. Technically, investors can perceive a negative crossover in SMA for a short while, and the price is above the 50-SMA. RSI index showcases an upward slope and buying volume is also moderate. Moreover, the price movement can reach upto the resistance of $1.27 in future trading sessions.
Resistance: $1.27
Support: $0.95
Mr, Nikhil Ingole is a Chief Editor at The Coin Republic with over five years of technical analysis & trading experience in Forex and Crypto. As a commerce graduate, he has taken a keen interest in blockchain’s future potentials in the financial industry. A keen cryptocurrency enthusiast, he is very supportive of new media projects, pioneer ideas and the Bitcoin community. He possesses strong technical, analytical skills and is well known for his financial market’s informative analysis. Other than crypto, Nikhil Loves to watch his favorite football team and keep up to date with the latest Formula 1 racing.


