
 Home
Home News
News

- BCH price is currently traveling in a parallel channel. Meanwhile, BCH/BTC is showing positive momentum of 3.09%
- BCH liquidation has seen an increase from the last couple of days. The shorts for BCH are increasing, showcasing a bearish momentum.
Bitcoin cash is a hard fork of BTC to solve the scalability issue of Bitcoin.BCH has seen an ROI of -2.52% since its inception. Despite the negative ROI, the coin has seen a tremendous price gain. The coin has also kept its transaction fees lower while making it a scalable solution for common investors. BCH project a rise up to $4000 at the end of this bull season.

Bitcoin cash is currently ranked 14 with a market capitalization of $11,349,586,385.The Volume($2,961,458,739) of the coin has seen a rise of 18.28% in the intraday session.

BCH Long And Shorts Are In A Truce For Now
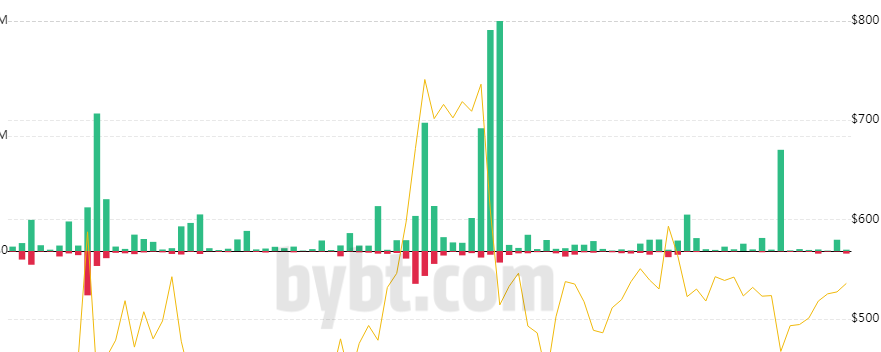
The above graph depicts the liquidation ratio of BCH. Bitcoin cash has seen a flash crash on Mar 24, 2021. After the crash, the coin recovered quickly while the liquidation went up for the coin. Perpetual swaps of BCH have also seen an increase in the shorts. If we look at the swaps data for the coin of MAR,31 2021, one can find that the shorts are increasing in comparison to the longs. Due to the sharp rebound of the coin, there is a positive divergence in the derivatives market’s funding rate. The ratio of these can tell the price movement. One should use other indicators to get a clear view of the price action.
Technical Indicators Projects A Bearish Moves For The BCH Price
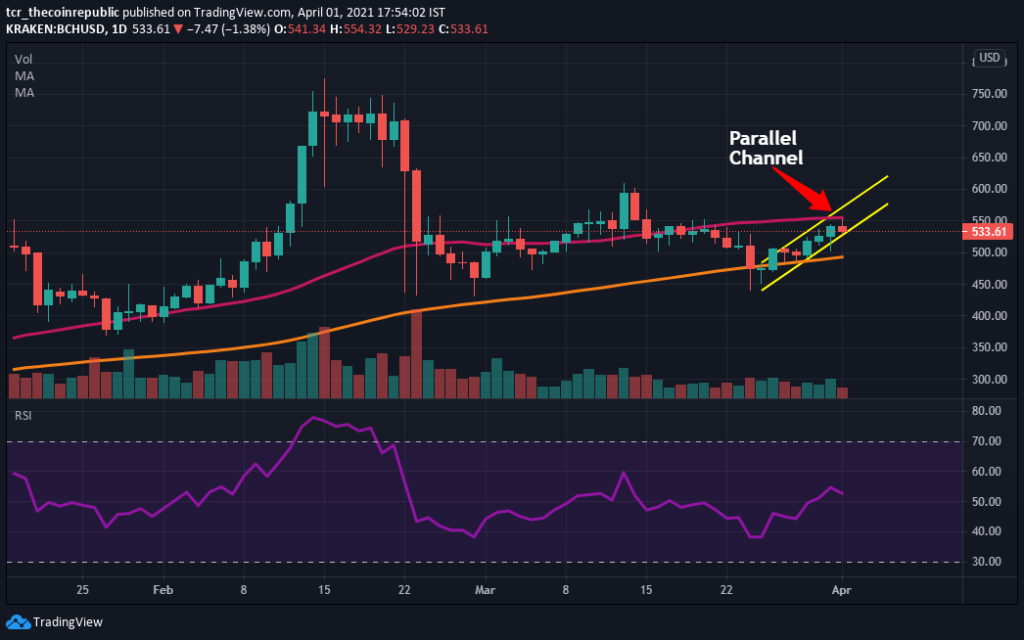
The weekly technical chart of the BCH price project a bullish momentum. BCH currently trades at $536.18 with an intraday gain of 4.46%. Resistance for the coin ongoing upside is at $600.Meanwhile, the bounce back for the coin can be seen from $500. Bitcoin cash is currently below the 50 and above 100 Moving average. The 50MA line is at $559, making it a temporary resistance for the coin. BCH daily chart shows that the price is moving inside the parallel channel. If the breaks 10% below the channel, then a strong downtrend can be seen. BCH can see a downtrend in the upcoming days. The BCH/BTC pair can also see an uptrend in the forthcoming days.
RSI(Neutral): It is currently trailing at 52 while showcasing its presence in the neutral zone. There is no slope formation in the RSI, which showcases that price may remain in a consolidated area. The overall sentiment of RSI is Neutral.
Conclusion
Bitcoin cash has seen a gain of more than 150% from the start of the year. BCH price project a consolidated momentum for the future. The BCH/BTC pair can also see an uptrend in the upcoming months. Investors should do their due diligence before investing.
Technical Levels
Major Support:$500
Major Resistance:$600

Adarsh Singh is a true connoisseur of Defi and Blockchain technologies, who left his job at a “Big 4” multinational finance firm to pursue crypto and NFT trading full-time. He has a strong background in finance, with MBA from a prestigious B-school. He delves deep into these innovative fields, unraveling their intricacies. Uncovering hidden gems, be it coins, tokens or NFTs, is his expertise. NFTs drive deep interest for him, and his creative analysis of NFTs opens up engaging narratives. He strives to bring decentralized digital assets accessible to the masses.


