
 Home
Home News
News
- Cardano price is in the accumulation zone on the daily chart. Meanwhile, the ADA/BTC pair is seeing a negative momentum with a loss of 1.42%.
- ADA bears see a rise from the last three months. Meanwhile, the technical indicators do not show any bullish move signs.
Cardano has always caught investors’ eye due to its aim of redistributing power from unaccountable structures to the margins to individuals. ADA price projection shows a gain up to $8 in upcoming months. ADA is highly correlated with BTC and expects to grow further up to $10 by the end of next year.

Cardano has become 100% fully decentralized. Currently, the block rewards come from inflation. This will be reduced over time and as the network grows transaction fees will be the funding mechanism that incentivises block production.Block production will be left 100% free to the competitive market.

ADA is currently ranked 5th, with a market capitalization of $53,809,986,568.The volume ($53,809,986,568) of the coin has seen an increase of 10.6% in the 24-hour time frame. The volume to Market capitalization ratio for the coin is 0.078. If the ratio goes above 0.8, then a buying rush can be seen.
Bears Are Increasing their Grasp On ADA Price
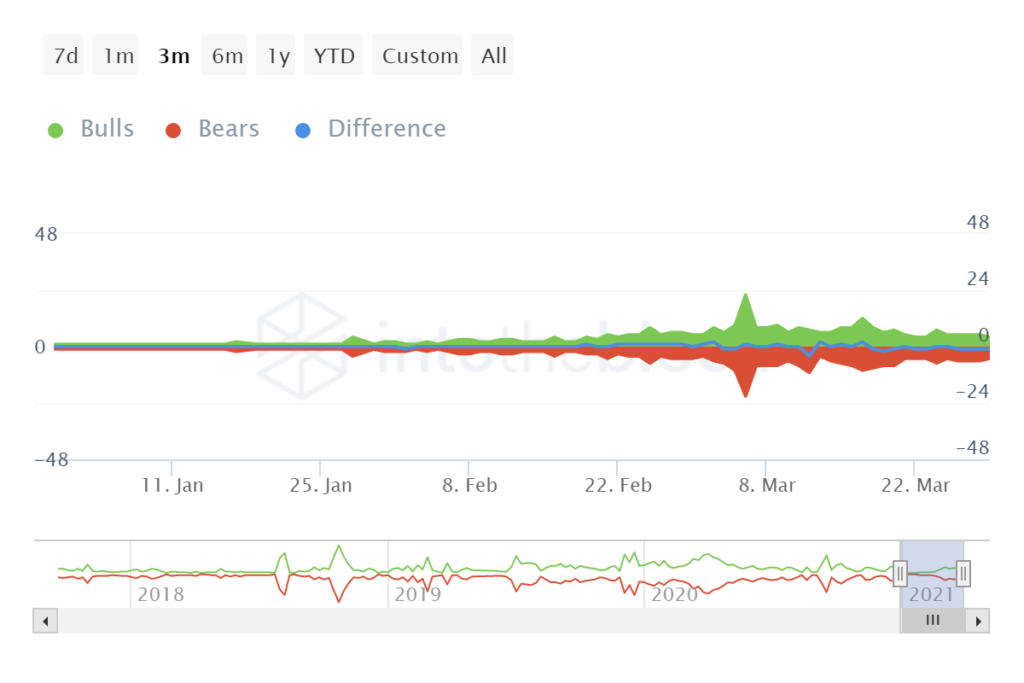
The above graph shows a relation between the buyers and sellers in a three months time frame. This graph tells how many addresses have bought or sold Cardano 1% or more of the total volume on that particular day. ADA has seen a rise in the bears from March 2021. One can forecast that the price may adversely affect upcoming months.
Cardano has launched its operation in the African Continent to disrupt the traditional supply chain. These can be an exciting thing to look out for and how it will playout for the Cardano.
Technical Indicators Projects A Bearish Momentum For ADA Price
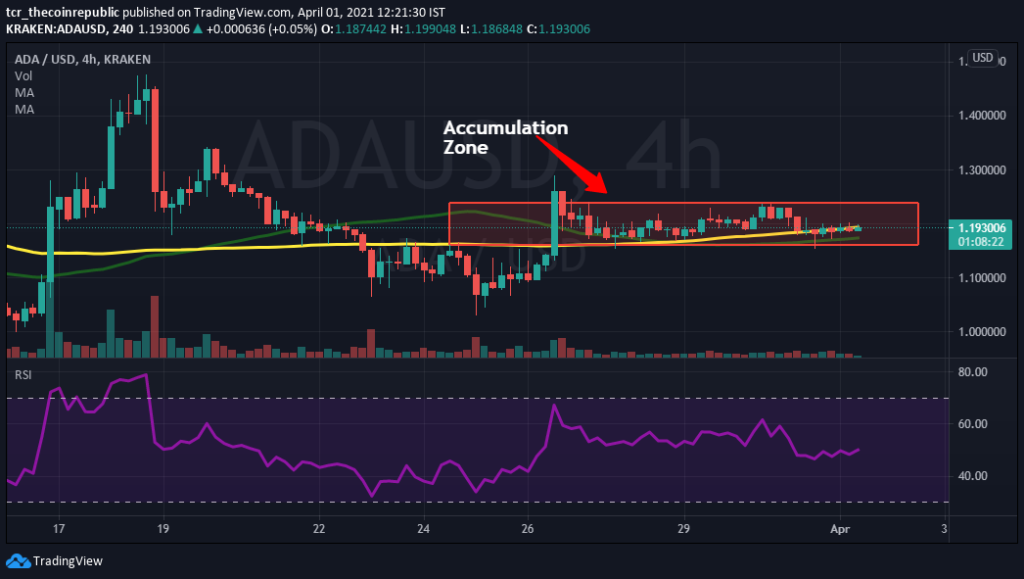
The weekly technical chart for Cardano showcases a bearish momentum. On coming to the daily chart, ADA price is not showing any sign of positive recovery. Cardano price is trading above 50 and below 100 Moving Average. The 50MA price is at $1.17, making it temporary support for the coin. The coin’s resistance on the upside will be at $1.3, and on the downside, it will see a bounce back from $1.1.ADA has formed an accumulation zone in the 4-hour time frame. If the price breaks 10% below the area, then a robust bearish momentum can be seen. Cardano can see a downtrend below $1 in the upcoming days.
RSI(Neutral): It is currently trailing at 50.9, showcasing its presence in the neutral zone. There is no slope formation in RSI, which suggests a consolidated momentum. If it crosses above the threshold of 60, then a strong bullish momentum can be seen.
Conclusion
ADA price projects a downtrend for a short period.ADA price can reach up to $8 until the end of this bull season. The ADA/BTC pair can also see a bullish move. An Investor should do their due diligence before investing.
Technical Levels
Major Support:$1.1
Major Resistance:$1.3

Adarsh Singh is a true connoisseur of Defi and Blockchain technologies, who left his job at a “Big 4” multinational finance firm to pursue crypto and NFT trading full-time. He has a strong background in finance, with MBA from a prestigious B-school. He delves deep into these innovative fields, unraveling their intricacies. Uncovering hidden gems, be it coins, tokens or NFTs, is his expertise. NFTs drive deep interest for him, and his creative analysis of NFTs opens up engaging narratives. He strives to bring decentralized digital assets accessible to the masses.


