
 Home
Home News
News

- BAT is on an uptrend for the past three months now due to various reasons, such as BAT was featured on Grayscale. CEO Michael Sonnenshein announced that BAT was one of the five tokens added to the Grayscale lineup; Japan’s bit bank exchange announced it would add BAT support
- Dip in price started in mid-March has resulted in an ascending triangle that might drive prices higher after a breakout
- RSI is at 62.20, indicating the coin is near an overbought zone in the daily timeframe
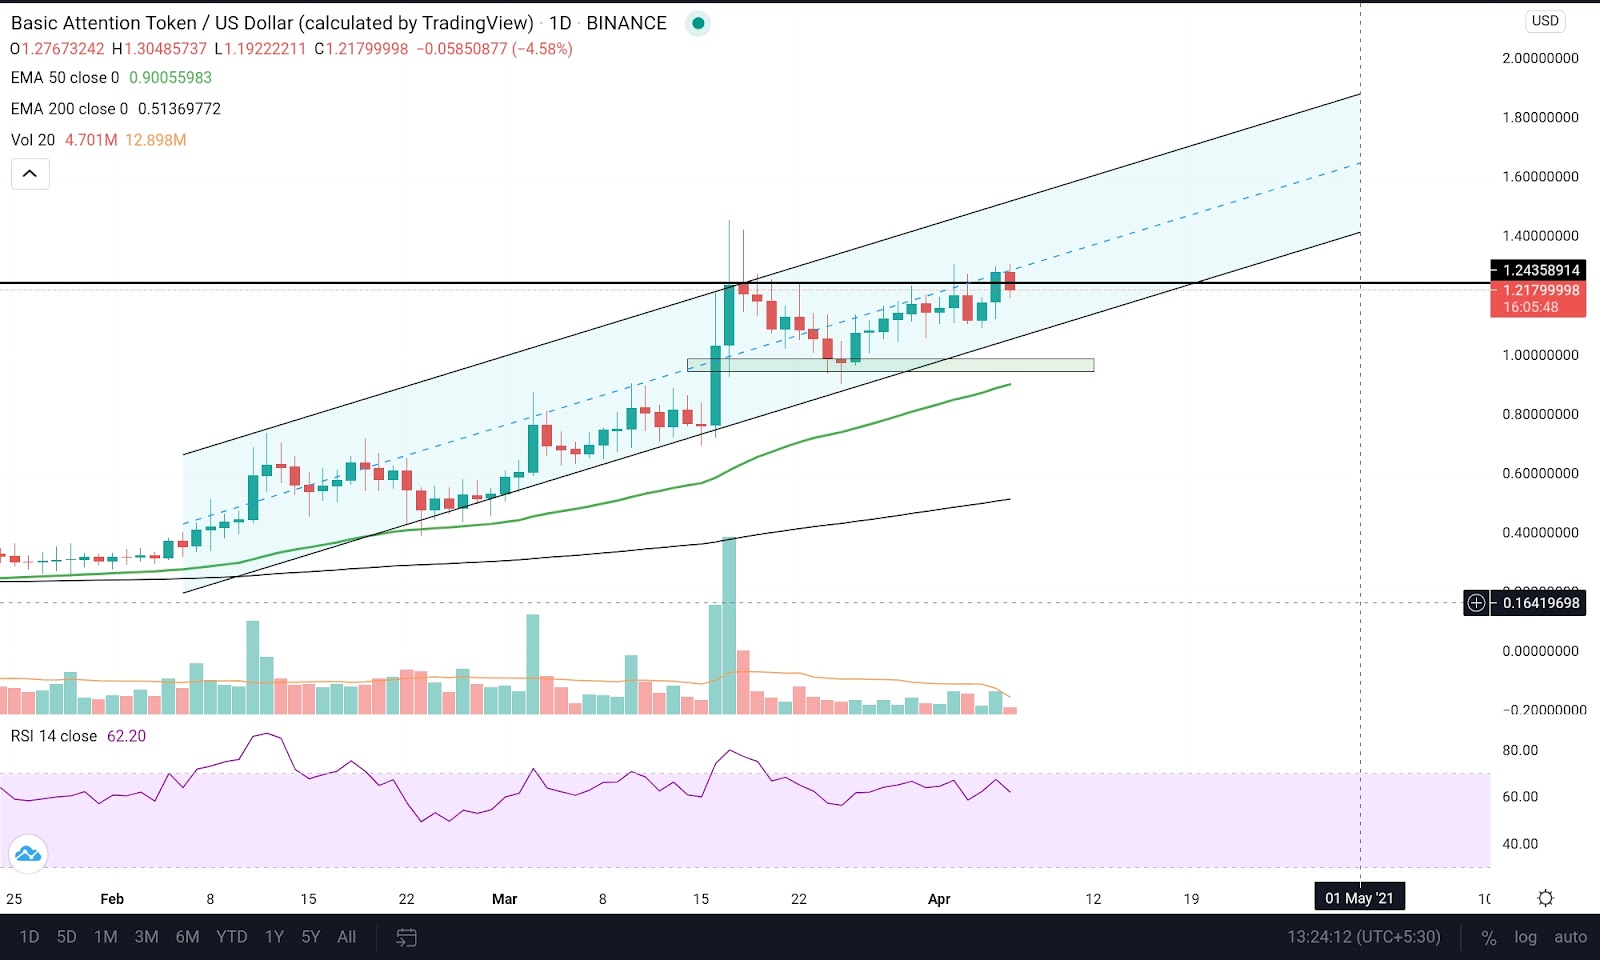

Basic attention token has been rising in a parallel channel, but in mid-March, a resistance was developed near $1.24 in the daily timeframe and the price reversed from there to a support zone of $0.94 to $0.98. The price is currently near the resistance zone of $1.23 to $1.28 in the 4-hour timeframe. The ascending triangle pattern is observed, which might help rejuvenate the uptrend. Volumes are on the lower side, but they might increase on breakout. The market capitalization of coin is $1,815,638,158 and the 24 hour volume is $515,464,48.

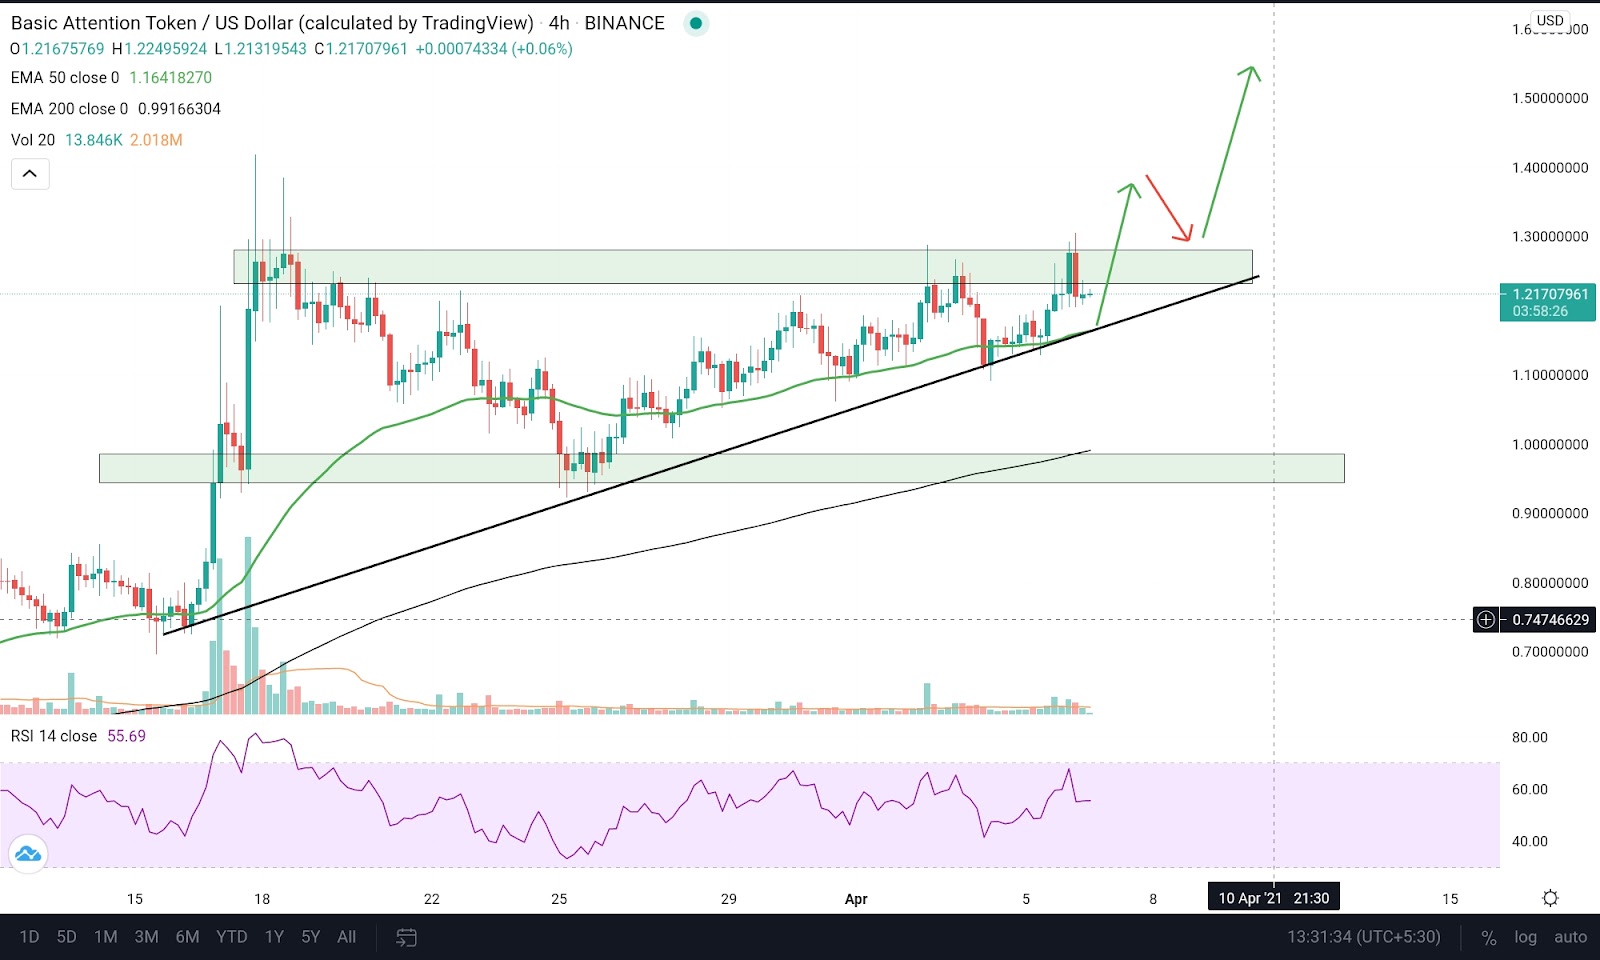
The price is forming an ascending triangle in the 4-hour timeframe. Wicks developed in the resistance zone of $1.23, and $1.28 could indicate another dip towards the trendline before the breakout of this level. Retest on this level would be a great entry opportunity.
An up move of 10-15% could be expected if volume supports the breakout.
However, if the prices fall below the support trendline, then the support zone from $0.94 to $0.98 would be the next prominent support for the price other than the 50EMA and 200 EMA.
RSI at 62.20 is near the overbought zone on a higher timeframe, which might forecast another dip towards the support trendline. The coin volume is below average for now, but increased buying volume could also support breakout.
50 EMA(green) supports the price in the 4-hour timeframe and 200 EMA (black) is below 50 EMA, giving a bullish signal.
Conclusion
Breakout of the resistance zone could be an excellent entry initiative, but one must be careful and wait for a retest. If the ascending triangle pattern fails, then the following prominent support levels could be 50 EMA and the previously mentioned support zone.
SUPPORT LEVEL – support zone of $0.94 to $0.98, 50 EMA, Trendline of ascending triangle
RESISTANCE LEVEL – the zone from $1.23 to $1.28(resistance level of ascending triangle)


