
 Home
Home News
News

- BTT price action plunged from $0.01318 to $0.01077 on Tuesday’s trading session
- The 24-hour volume in BTT is at $7,789,510,540 with a 38.35% decrease
- The BTT/BTC pair was trading at 0.0000001832 BTC with a loss of 19.33%
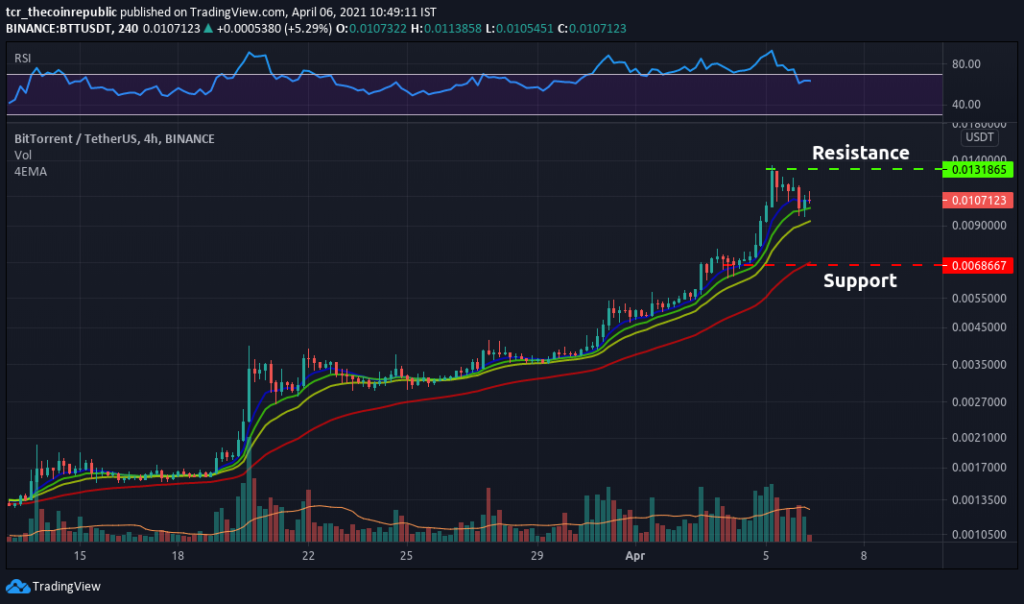
The 4-hour technical chart of BTT price action forecasts a slight downtrend. According to pivot points, BTT’s critical support level is placed at $0.00686. While diving into the weekly chart of a 4-hour time-frame, it completes a bearish engulfing candlestick pattern representing a bearish trend with high reliability.

EMA- (8,13,21,55) acts as another strong support in the coin. EMA-8 (blue) intersects above the EMA-55 (red), which projects a strong bullish trend. The price is fighting the EMA-8. Investors may perceive a positive crossover in the EMA, and the price will also follow the positive direction.

RSI indicator (BULLISH), with a value of 62.90, indicates a buy signal in the coin. Moreover, Investors can see a flat slope in the index, and it may now cool down in future trading sessions.
The volume of (5.73B) represents a selling volume that is below the Volume MA (24.47B) of 20-days. High buying pressure has now vanished in Bittorrent to drive its price to higher levels.
BTT Price Action May Cool Down Now
BTT price traded at $0.01077 with a loss of 18.57% in the last 24-hour and 188.50% up in the weekly time-frame. In contrast, the market capitalization stands at $7.17 billion. Technically, investors can perceive a positive crossover in EMA, and the price is fighting to stay above the 8-EMA. RSI index showcases a flat slope. Moreover, the price movement can be towards the resistance of $0.01318 in future trading sessions if rebuying volume increases.
Resistance: $0.01318
Support: $0.00686
Mr, Nikhil Ingole is a Chief Editor at The Coin Republic with over five years of technical analysis & trading experience in Forex and Crypto. As a commerce graduate, he has taken a keen interest in blockchain’s future potentials in the financial industry. A keen cryptocurrency enthusiast, he is very supportive of new media projects, pioneer ideas and the Bitcoin community. He possesses strong technical, analytical skills and is well known for his financial market’s informative analysis. Other than crypto, Nikhil Loves to watch his favorite football team and keep up to date with the latest Formula 1 racing.


