
 Home
Home News
News

- GRT price has broken down the support of 100MA on the 4hr chart.In contrast,GRT/BTC pair has also seen a loss of 6.89%
- The Graph price has seen a gain of more than 388% from the start of the year.Mean while the technical indicators suggest a downtrend for the price.
GRT is currently ranked 57th with a market capitalization of $1,992,946,097.The volume($301,679,297) of the coin has seen a gain of 3.7% in the intraday time frame. The market capitalization to volume ratio for the coin is 0.15, and if it crosses more than 0.7, then a buying rush can be seen. GRT price forecast a downtrend for upcoming days

Why To Invest In GRT Coin?
The Graph is a blockchain powered indexing protocol .It is used for querying data for networks like Ethereum and IPFS. GRT is also used in powering many applications in both DeFi and the broader Web3 ecosystem.The graph is continuously working towards bringing reliable decentralized public infrastructure to the mainstream market.

Despite doing a partnership with the Polkadot ,Whales are exiting the coin This could be a bad sign for the GRT price and can see a plunge upto $1
Technical Indicator Suggest A Bearish Move For GRT Price
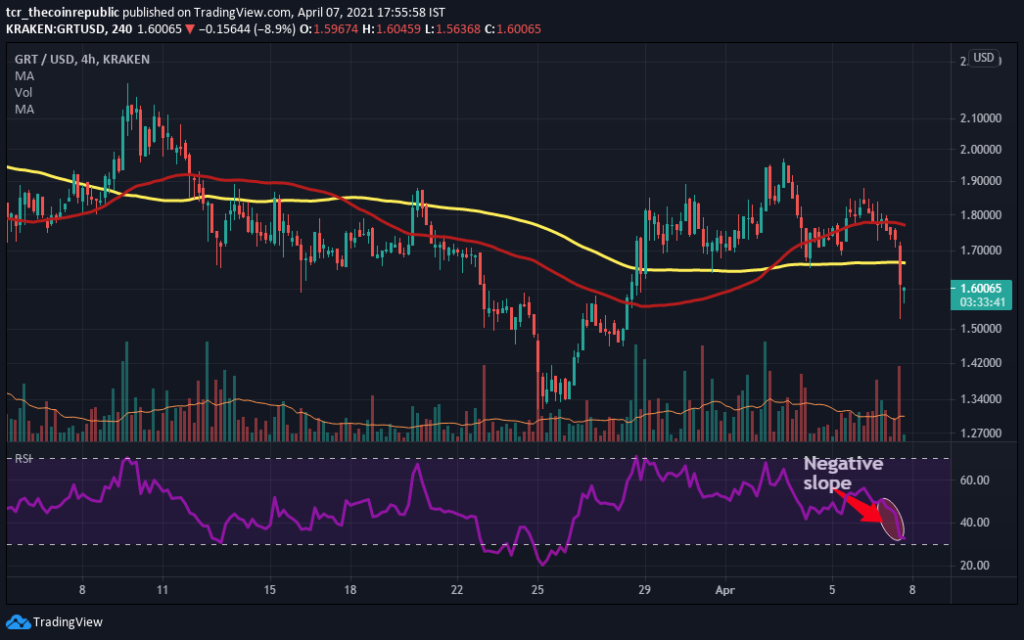
The weekly technical chart of The Graph showcases a consolidated momentum. On coming to 4hr cart, GRT price is below 100 and 50 Moving average. The 100 MA(Red) line is at $1.16, making it temporary support for the coin. Resistance for the coin on going upside is at $1.8. While on the downside, the coin can see a bounceback from $1.There is a formation of bearish engulfing pattern on the chart If the price goes 10% below the support ,then a new low upto $0.7 can be formed.THETA/BTC pair is currently performing negatively and can break the previous support zone.
RSI(Bearish): It is trailing at 32.05 while showcasing its presence in the oversold zone. There is negative slope formation, highlighting that price can see a downtrend in the upcoming days. The overall sentiment of the RSI is bearish .
Conclusion
GRT price has given excellent returns in the past.It is currently seeing a downtrend but can see a recovery .GRT/BTC pair can also see a downtrend with a significant momentum.An investor should do their due diligence before investing.
Technical Levels
Major Support:$1
Major Resistance:$1.8

Adarsh Singh is a true connoisseur of Defi and Blockchain technologies, who left his job at a “Big 4” multinational finance firm to pursue crypto and NFT trading full-time. He has a strong background in finance, with MBA from a prestigious B-school. He delves deep into these innovative fields, unraveling their intricacies. Uncovering hidden gems, be it coins, tokens or NFTs, is his expertise. NFTs drive deep interest for him, and his creative analysis of NFTs opens up engaging narratives. He strives to bring decentralized digital assets accessible to the masses.


