
 Home
Home News
News

- DOT rebounded on the 20 EMA ($38.68), suggesting a good buying opportunity
- The daily time frame indicates the formation of a very noticeable symmetrical triangle formation, which witnessed a downward breakout and retested back upwards, showing a bullish setup
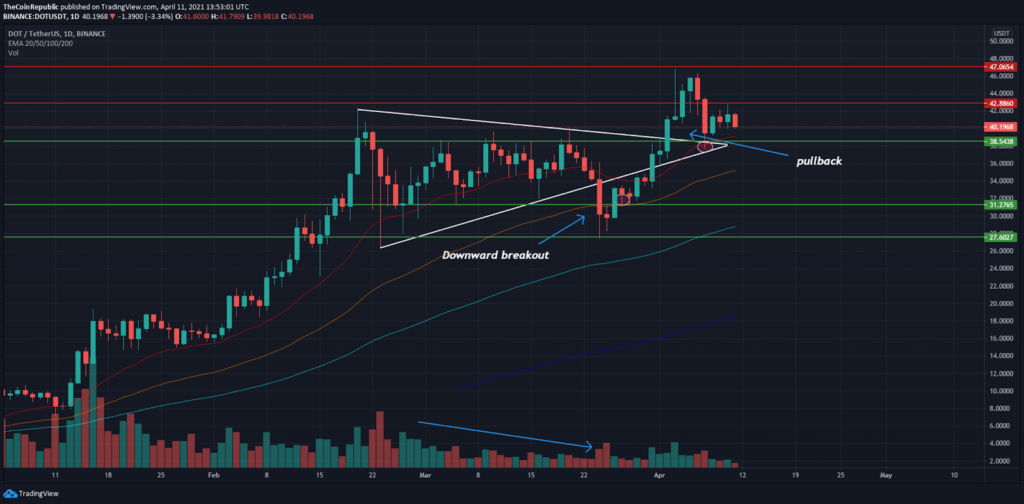
DOT price has encountered a bull run ever since it formed a symmetrical triangle pattern at the beginning of the year. Until then, the token has surged by 142%. A similar situation is currently taking place after seeing the token form a symmetrical triangle pattern that had a downward breakout and a sudden pullback towards the upside—the downward breakout resulting from a consolidation pattern and massive decline in volume. Within a few days, we noticed that the price had reversed and blasted its way to the triangle’s top. The 20 EMA at $38.68 turned out to be a quality support level after we saw DOT bounce off on that range allowing buyers to buy the dip. As of now, the buyers are struggling to break the overhead resistance of $42.13. Failing that level would result in the start of a new rally with a target objective of smashing the latest high and forming new highs simultaneously.

DOT PRICE ON ITS WAY TO FORM A NEW BULL FLAG


DOT price market dynamics on a 4-hour time frame suggest a particular pattern that DOT has been following for a long time. The pattern indicates that the token tends to undergo periods of consolidation at $48 followed by trend acceleration, resulting in new bull flags. This particular structure stimulates the token to build significant new highs. These arrangements convince the bulls that they are in charge.
DOT price is stable above its key EMA levels, supposed to act as strong support levels. The 20 EMA has already been tested recently and quite a couple of times. The 50 EMA is expected to provide support at $35.
The RSI seems to be hanging in the neutral zone at 44 level, indicating no particular buying or selling signals.
CONCLUSION
DOT price has been framing significant bull patterns such as bull flags and symmetrical triangles, hinting that an upward move is guaranteed. If the bears can defend the resistance at $42.68, then the upward momentum will continue to grow. By the end of April, a target of $53 and then towards $57 seems very much possible. It is anticipated that the token will respect the ascending resistance line and rise higher.
SUPPORT : $38.68. $31.27
RESISTANCE : $47, $42.88

Nancy J. Allen is a crypto enthusiast, with a major in macroeconomics and minor in business statistics. She believes that cryptocurrencies inspire people to be their own banks, and step aside from traditional monetary exchange systems. She is also intrigued by blockchain technology and its functioning. She frequently researches, and posts content on the top altcoins, their theoretical working principles and technical price predictions.


