
 Home
Home News
News


- TERRA COIN price is in between 0.5 and 0.382 Fibonacci levels indicating a pullback completion in an ideal case
- A big directional move is expected at LUNA coin price, but the direction is debatable
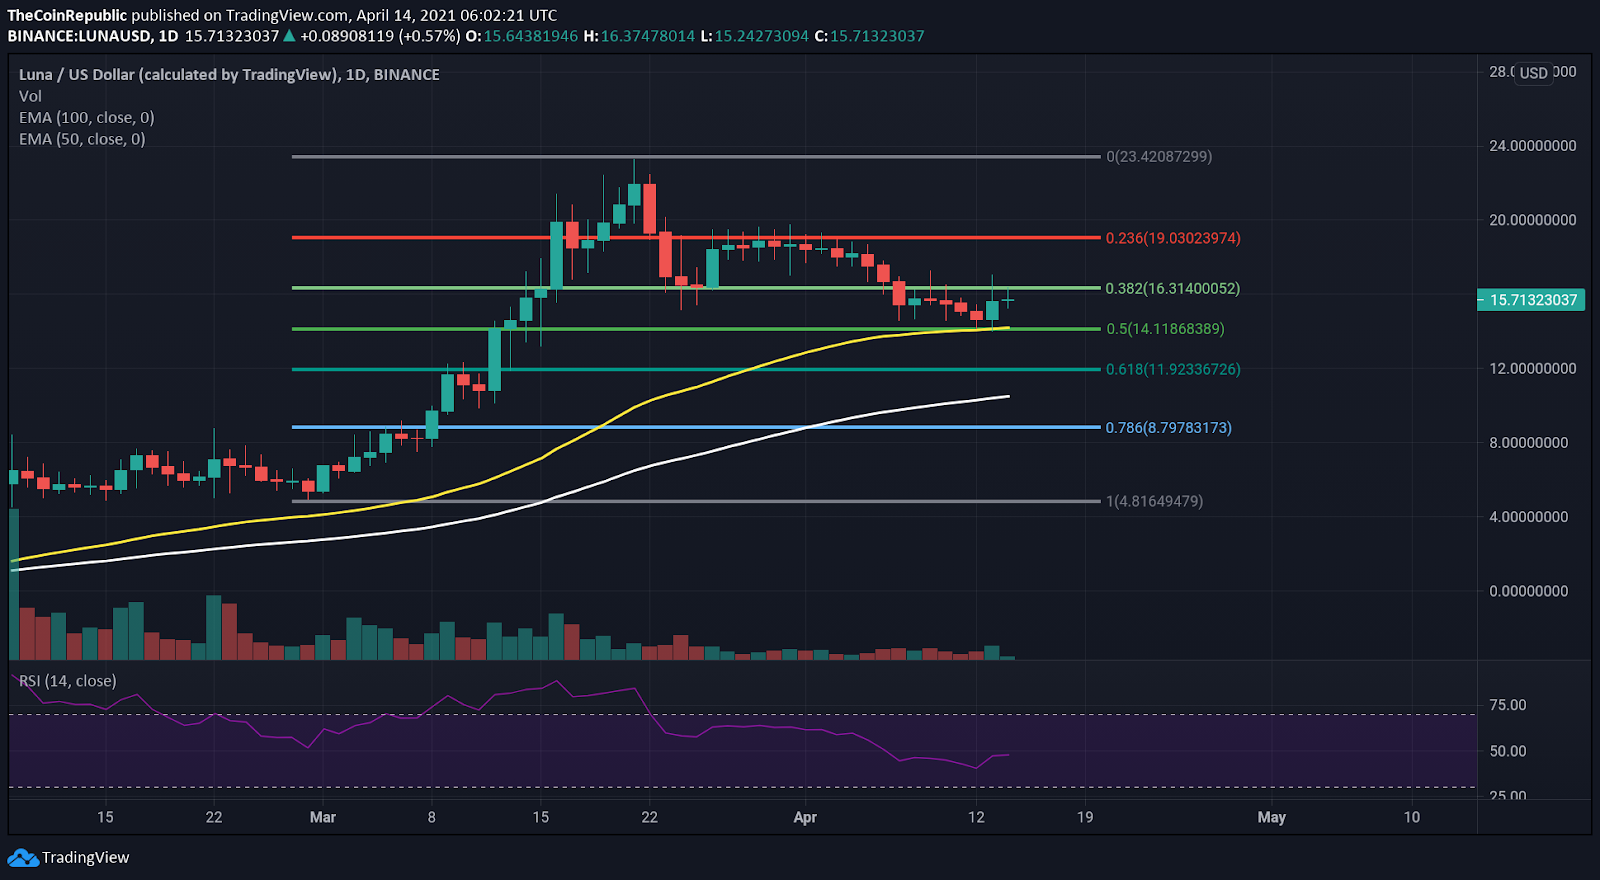

Terra coin recently faced a lot of supply after creating an all-time high near $22.4. Currently, the luna coin price is trailing close to $16 and between Fibonacci levels of 0.5 and 0.382. The price is supported by the 50 EMA (yellow) in the daily timeframe. These signals could indicate the start of an uptrend shortly. However, all support zones could break due to fear-induced more supply dump. Terra coin price is at a very crucial level which could make it or break it for luna. The Terra Coin market capitalisation is $5,987,141,909 (+2.79%), and the 24hour volume of the coin is $429,878,115. (+86.00%)
WAIT FOR THE MOMENT OF TRUTH

Terra coin has formed a descending triangle candlestick pattern in the 4-hour timeframe. Recent support of this triangle has been tested twice, making its credibility questionable. Another test of this support zone could result in another fall of the price up to $12.80. However, this descending triangle’s resistance trendline could also be broken as the price has completed the pullback criteria in the daily timeframe, which might lure the bulls back. Nonetheless, the price is below a minor resistance zone near $16, which could push the price down.
In the 4 hour timeframe, the price is below the 50 EMA(yellow) and barely clinging to 200 EMA(white). Also, the 50 EMA is quite close to the 200 EMA, giving a hint of a bearish crossover. This crossover could lead to a downside breakout of the descending triangle bringing the LUNA price back to $12 or even less.
The relative strength indicator is neutral for now, but as the sudden buying pressure is seen, the RSI could reach overbought levels faster than expected.
Conclusion
A bearish breakout has more chance than a bullish one, as the ema crossover, the strong resistance trendline, questionable support zone lead one towards the bearish sentiment. However, the price being close to the trendline and the support of both EMA could bring the final verdict in favour of the bulls. Early traders must be cautious as the high volatility and the possibility of fake breakouts could take you to the opposite side of the trend.
Support – $12.80, 200 and 50 EMA, and the mentioned support zone
Resistance – $19.13, the resistance trendline of the pattern and the mentioned resistance zone


