
 Home
Home News
News

- Bitcoin cash price building higher highs and lower low pattern, which indicates its bullish nature over the yearly chart
- The overall market condition are in favour of bulls and every dip can be utilised as buying opportunity
- The pair of BCH/BTC is trading above 20,50 and 100-DMA, with an intraday increment of +21.50% standing at 0.01784 BTC
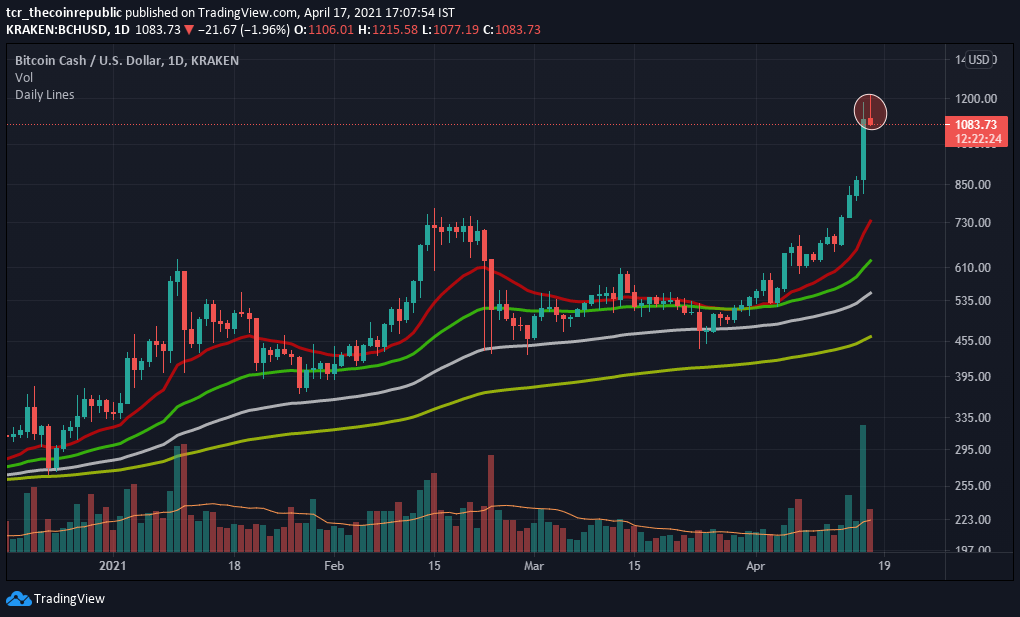
Bitcoin cash is showcasing bullish momentum over the yearly chart, as trading above all major resistance. The coin is in bullish momentum and creating higher highs and lower low patterns and placed above all the major & important moving averages of 20,50,100 and 200-Day. Meanwhile now the only major supply or resistance zone on the higher side is $1220 and $1430, similarly support on lower levels are situated at $620 and $540. Volume on yearly charts is also high and indicates increment in upcoming trading sessions and we can see levels of $1400 and $1650 in upcoming trading sessions.

Bitcoin cash price over the monthly chart is trading on a bullish note, with the rising support line. Likewise the coin is successfully placed above all major moving averages of 20,50,100 and 200-Day, and now no major resistance is placed on the higher side only $1220 and $1380. Support for monthly charts is situated at $640 and $535, however some retracement is expected from the higher side as BCH is trading in overbought territory. Currently BCH is trading at the price level of $1087 with intraday gain of +21.55%, with volume increment of +73.86% standing at $13,738,465,387. While BCH is standing at 10th rank according to total market capitalization standing at $20,404,677,958 up by +22.69%.

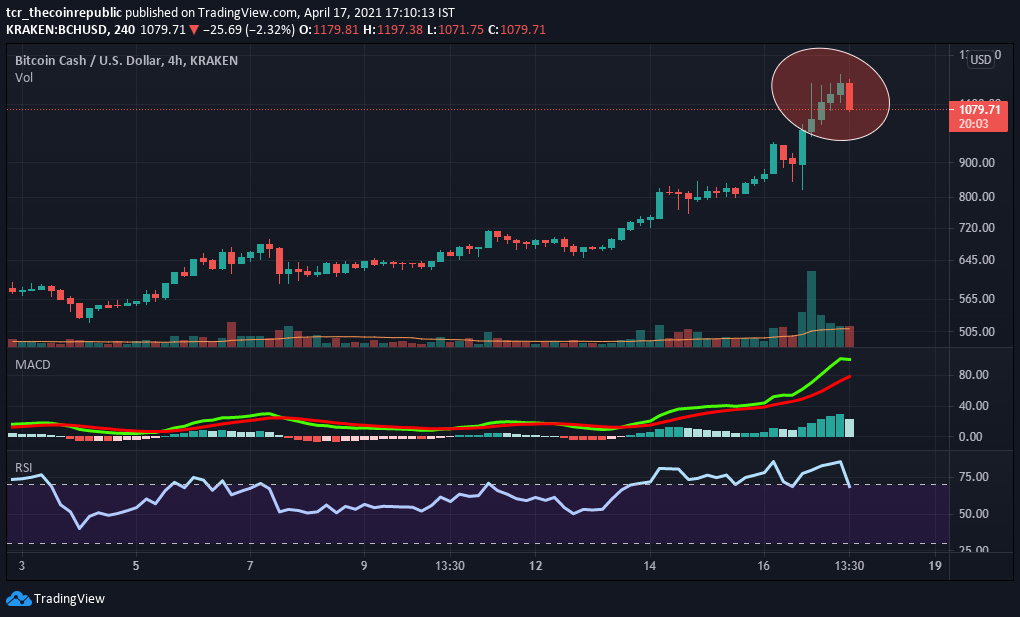
Relative Strength Index (CAUTION ) indicates bullish momentum while trading at 80.62. However, BCH after trading inside the overbought zone now it is heading towards the oversold zone and it is healthy for upcoming trading sessions.
Moving Average Convergence Divergence (CAUTION) currently indicates a bullish trend on the daily chart, as it is trading with the significance of the buyer’s signal line (green) over the seller’s line (red). However, now a profit taking and correction is expected.
Support levels: $620 and $540
Resistance levels: $1220 and $1430.
Join The Coin Republic’s Telegram Channel for more information related to CRYPTOCURRENCY NEWS and predication
Mr. Pratik chadhokar is an Indian Forex, Cryptocurrencies and Financial Market Advisor and analyst with a background in IT and Financial market Strategist. He specialises in market strategies and technical analysis and has spent over a year as a financial markets contributor and observer. He possesses strong technical analytical skills and is well known for his entertaining and informative analysis of the Financial markets.


