
 Home
Home News
News
- Vechain price in strong uptrend building higher highs and lower low sequence over the monthly chart with all technical parameters are in favour of bulls
- The coin rally now moving towards the benchmark of $0.3000, and has created its all time high of $0.2782
- The pair of VET/BTC is trading on bullish note above all major and important moving averages, currently standing at 0.000003826 BTC with an intraday jump of +39.10%
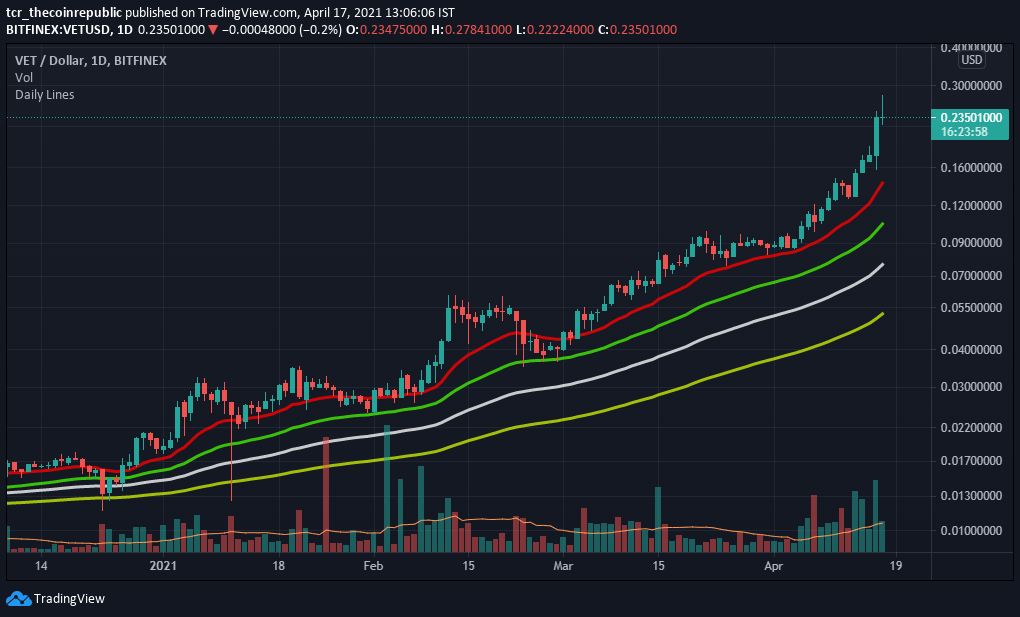
The Vechain price rally hits an all time high of $0.2782, due to strong uptrend or bullish momentum in the alt coins season. Meanwhile, the coin is successfully placed above all major or significant moving averages of 20,50,100 and 200-Day. However, now for further positive momentum, a short term retracement is expected from the higher levels which is healthier for upcoming bullish momentum. Similarly the profit taking or selloff from the higher side can be expected, as indicators suggesting over the chart. Support on the lower level is situated at $0.1430 (20-DMA) and $0.1050, likewise the resistance on the higher side is situated at $0.2800 and $0.3200.

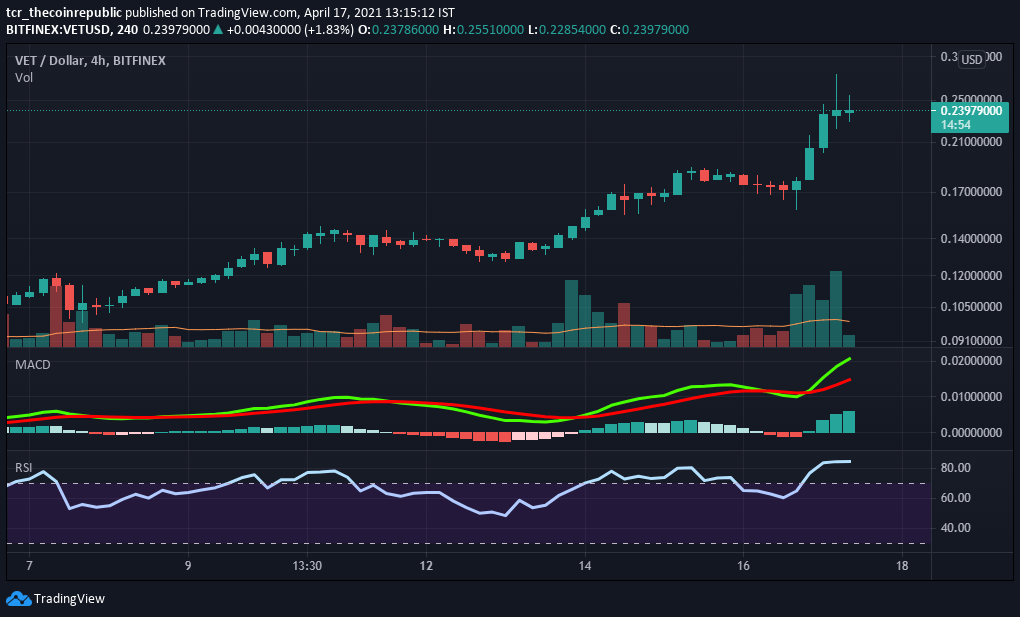
Vechain price over the weekly chart at a 4-hour time frame is now indicating some tiredness at the higher levels. After a bullish rally the coin seems overbought over the indicators and some weakness can be expected. However, every dip is a buying opportunity as the overall trend is still bullish. While the volume over the chart is also good, currently the volume in the last 24-hours jumped nearly +227% standing at $6,834,851,282. Presently VET price is trading at the level of $0.2430 with intraday gains of +40.57% and the total market capitalization stands at 13th rank standing at $15,595,932,262 with an increment of 41.75%.

Relative Strength Index (CAUTION) indicates sideways momentum while trading at 85.62. However, it is present inside the overbought zone and a correction is expected from higher levels.
Moving Average Convergence Divergence (CAUTION) currently indicates a bullish trend on the daily chart, as it is trading with the significance of the buyer’s signal line (green) over the seller’s line (red). However, a negative crossover is expected from the higher side.
Support levels: $0.1430 and $0.1050
Resistance levels: $0.2800 and $0.3200.
Mr. Pratik chadhokar is an Indian Forex, Cryptocurrencies and Financial Market Advisor and analyst with a background in IT and Financial market Strategist. He specialises in market strategies and technical analysis and has spent over a year as a financial markets contributor and observer. He possesses strong technical analytical skills and is well known for his entertaining and informative analysis of the Financial markets.


