
 Home
Home News
News

- Filecoin price after a bullish rally now trading inside the bullish flag pattern, However slipped from it all time high of $237
- The coin give massive returns of +8560% to its investors as from making lows of $1.83 to hitting the levels of $237
- The pair of BTC/FIL is also performing well as placed above all major moving averages standing at 0.002789 BTC with an intraday loss of +0.55%
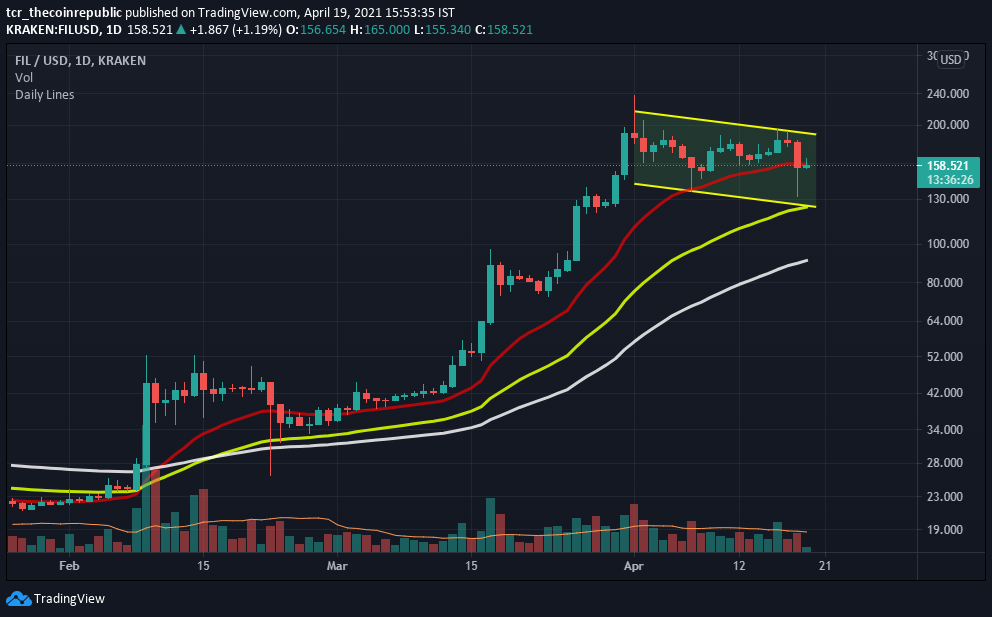
Filecoin price after a massive bullish rally now consolidating at the higher levels and has formed a bullish flag pattern. Meanwhile the coin is placed above all major and important moving averages of 20,50,100 and 200-Day, however no major spike in volume is observed as volume is under average line. Meanwhile, the breakout from the bullish flag pattern can give a result or target of $190 and $220. Support at the lower side is situated at $130 and $92 (50-DMA), likewise resistance on the higher side is placed at $180 and $240.

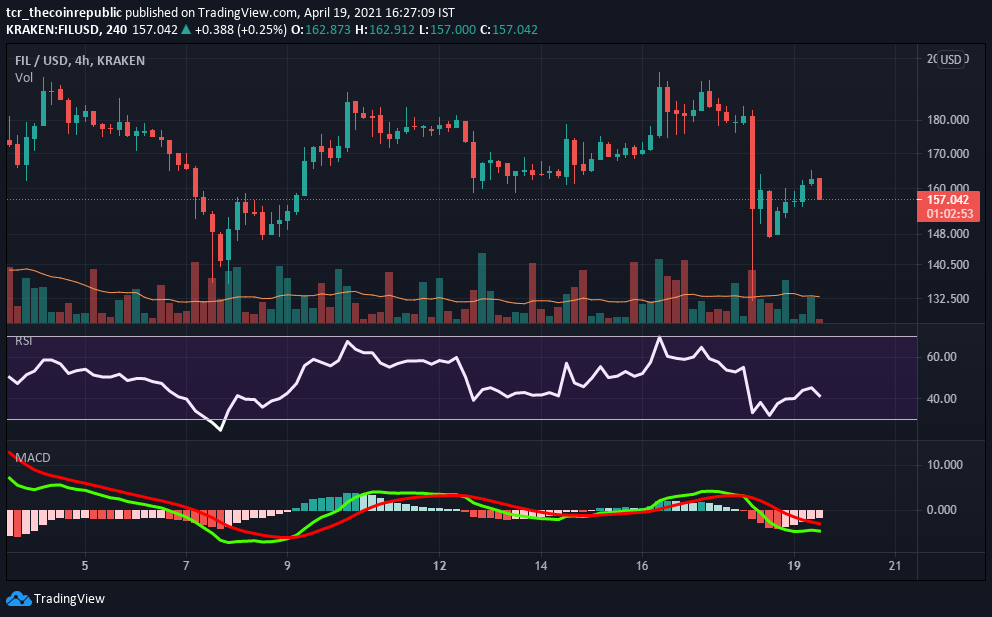
Filecoin price over the 4-hour time frame indicates some sideways trend over the chart, as after making a new all time high of $237 a sharp profit taking is observed. However, the overall trend or sentiment is still in favour of bulls and every dip is a buying opportunity. Currently, filecoin is trading at the price levels of $158 with intraday gains of +2.84% and volume dropped nearly -36% standing at $2,363,979,936. Whereas the coin stands at 17th rank with an increment of +2.86% in its total market capitalization standing at $10,687,087,346.

Relative Strength Index (NEUTRAL) indicates sideways momentum while trading at 42.82. However, after a sharp sell off it is indicating more weakness can be seen in the counter, as it is heading towards an oversold zone with no strength.
Moving Average Convergence Divergence (NEUTRAL) currently indicates a bearish trend on the daily chart, as it is trading with the significance of the seller’s line (red) over the buyer’s signal line (green). However, both lines are heading closer to each other and the crossover can generate bullish momentum.
Support levels: $130 and $92
Resistance levels: $180 and $240.
Mr. Pratik chadhokar is an Indian Forex, Cryptocurrencies and Financial Market Advisor and analyst with a background in IT and Financial market Strategist. He specialises in market strategies and technical analysis and has spent over a year as a financial markets contributor and observer. He possesses strong technical analytical skills and is well known for his entertaining and informative analysis of the Financial markets.


