
 Home
Home News
News

- Tezos price after a sharp correction from its new 52-week high of $7.67, which bounced well after testing 50-Daily moving average
- The overall trend is still bullish, as the price formed higher high and lower low sequence pattern creating a positive momentum
- The pair of XTZ is trading above 20,50 and 100-DMA, However is 200-DMA is acting as strong resistance stands at 0.0001125 BTC with intraday loss of -2.28%
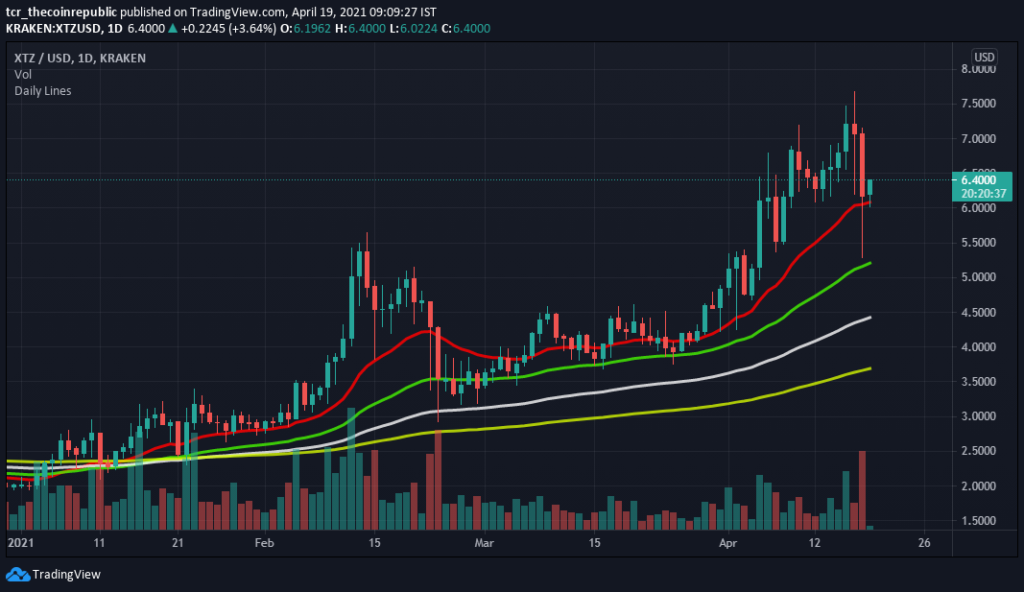
Tezos price over the monthly chart is trading on a bullish note, however a sharp correction of around -17% from it’s all time high of $7.67. Similarly a sharp recovery is observed after a heavy profit taking from higher levels, where XTZ bounded after testing the 50-DMA on lower side. However, currently the coin is successfully placed above all major and important moving averages of 20,50,100 and 200-Day. Meanwhile the overall market sentiment is still bullish and every dip can be utilized as a buying opportunity. Support on lower levels is placed at $5.20 and $4.40, likewise resistance on the higher side is situated at $7.68 and $8.25.

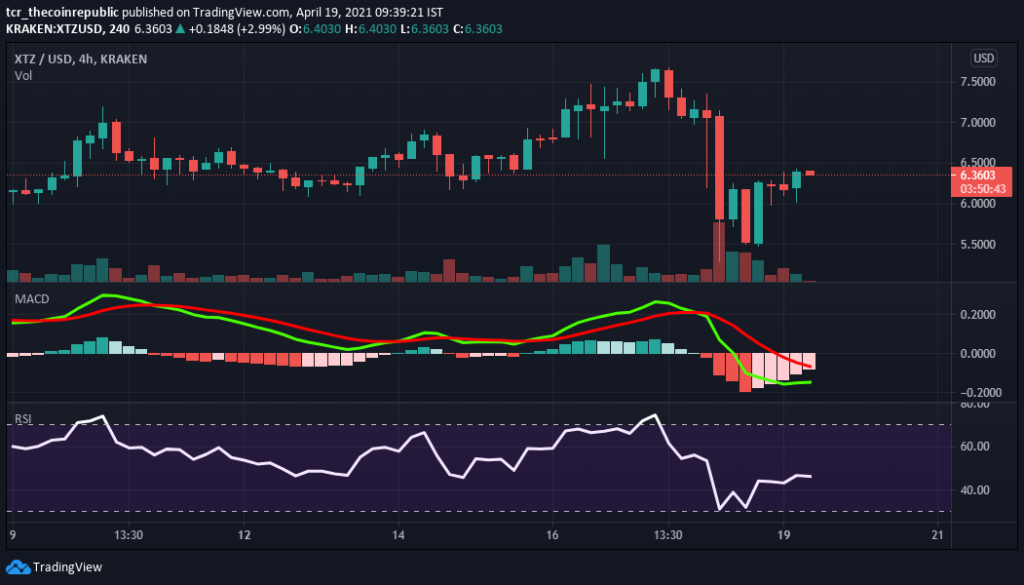
Tezos price over the 4-hours time frame is now indicating sign of recovery, as some indicators indicate upcoming positive price action. Meanwhile, the volume is to be looked out, while after a sharp selloff the price is now indicating some sign of recovery. Support on the lower level is placed for intraday at $5.50 and $4.80, while resistance is situated at $7.10 and $7.68. Currently, XTZ is trading at the price level of $6.13 with intraday gains of +18.08% and volume in the last 24-hours jumped nearly +33.42% standing at $793,206,552. Likewise total market capitalization stood at 33rd rank at $4,832,091,979 with intraday gains of +18.55%.

Relative Strength Index (NEUTRAL) indicates sideways momentum while trading at 45.62. However, after a sharp correction from overbought zone it tested oversold zone and now trading flat with no sign of any momentum.
Moving Average Convergence Divergence (NEUTRAL) currently indicates a bearish trend on the daily chart, as it is trading with the significance of the seller’s line (red) over the buyer’s signal line (green). However, both the lines are heading closer to each other and the crossover can generate bullish momentum.
Support levels: $5.20 and $4.40
Resistance levels: $7.68 and $8.25.
Mr. Pratik chadhokar is an Indian Forex, Cryptocurrencies and Financial Market Advisor and analyst with a background in IT and Financial market Strategist. He specialises in market strategies and technical analysis and has spent over a year as a financial markets contributor and observer. He possesses strong technical analytical skills and is well known for his entertaining and informative analysis of the Financial markets.


