
 Home
Home News
News

- XRP Price after a strong bullish momentum tested high of $1.96, However, a sharp profit taking or sell-off is observed and created a bull trap
- The coin slipped below short term moving averages of 20 and 50, meanwhile, XRP is now trying to take support of 100-DMA
- The pair of XRP/BTC is also trading under pressure, standing at 0.00002374 BTC with an intraday loss of -5.27%
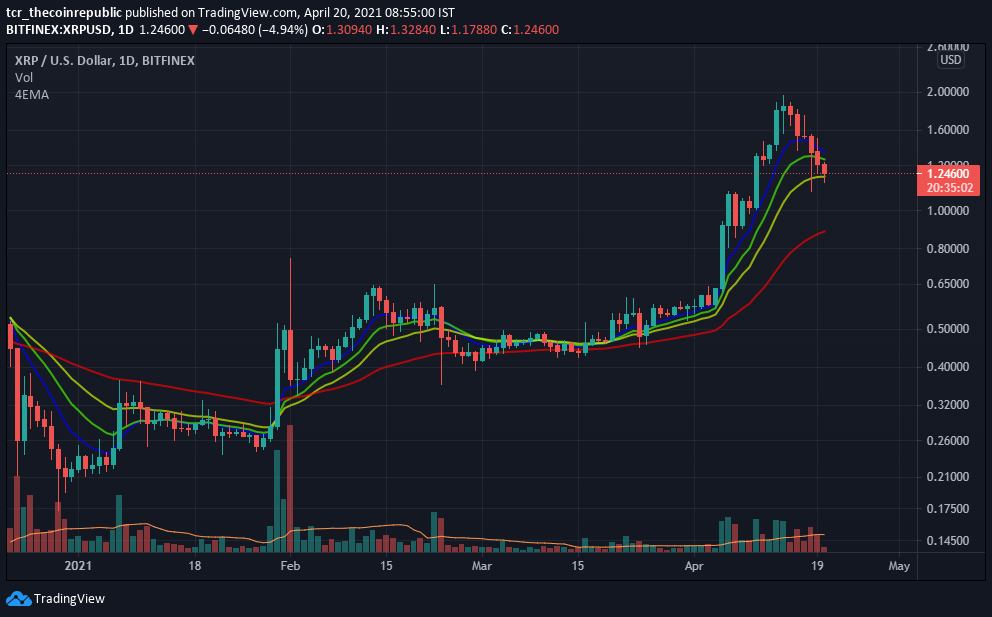
XRP price after a most awaited rally is now trading under pressure as after testing its new 52-week high of $1.96, the selling pressure is observed on the higher side. However, the coin slipped sharply from the higher levels and is now trading below short-term moving averages of 20 and 50-Day.

At the same time, it is trying to take support from 100-DMA since the volume over the monthly chart indicated caution. Support at the lower side is placed at $1.10 and $0.90. Likewise, resistance on the higher side is situated at $1.55 and $1.20. Since the overall trend is still bullish, so buy on dips is recommended.

XRP price over the weekly time frame is trading near the support zone; the coin is trading under pressure after making a high of $1.96. Meanwhile, now the recovery is expected from lower levels, the support on the lower side is at $1.10 and $0.90. In comparison, the resistance on the higher side is placed at $1.60 and $1.90. Currently, the coin is trading at the price level of $1.32 with an intraday loss of -7.35%, and volume over the last 24-hour dropped nearly -6.63%, standing at $17,782,516,553. Meanwhile, the XRP stands at 4th position with a total market capitalization stands at $60,143,459,124 with an intraday loss of -7.87%.
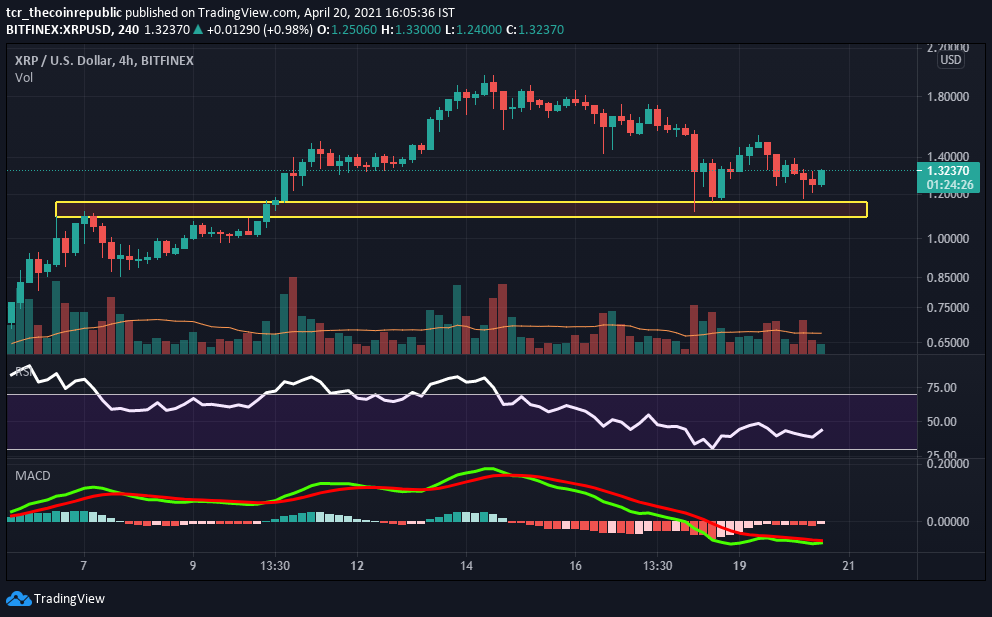
Relative Strength Index (NEUTRAL) indicates bullish momentum while trading at 44.62. However, it is present heading towards the overbought zone after recovering from lower levels.
Moving Average Convergence Divergence (BULLISH) currently indicates a bullish trend on the daily chart, as it is trading with the significance of the seller’s line (red) over the buyer’s signal line (green). However, both the lines are heading closer, and a positive crossover is expected.
Support levels: $1.10 and $0.90
Resistance levels: $1.55 and $2.00
Mr. Pratik chadhokar is an Indian Forex, Cryptocurrencies and Financial Market Advisor and analyst with a background in IT and Financial market Strategist. He specialises in market strategies and technical analysis and has spent over a year as a financial markets contributor and observer. He possesses strong technical analytical skills and is well known for his entertaining and informative analysis of the Financial markets.


