
 Home
Home News
News

- TRX is currently facing strong hindrances inside the $0.30 and $0.38 range.
- TRX seems to be forming a head and shoulder pattern on the daily chart.
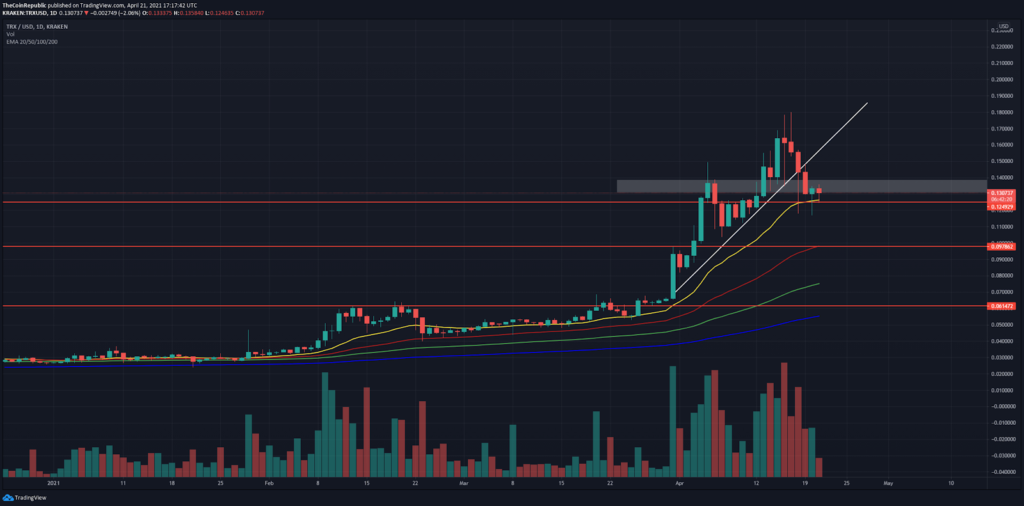
- The token has recently broken out of a 3-year resistance.
Looking upon the daily chart of TRX, it is perceived that this token is in the midst of forming a head and shoulder pattern. The left shoulder and the head have already been established which means that TRX is likely to undergo a pullback before it completes the right shoulder. This bearish case scenario could drive the price of TRX back to $0.09 which is a 25% decline from the current price. TRX has broken from the ascending support line and shows no signs of reversal as of now. On the upside, if TRX manages to overcome the consolidation range of $0.30 to $0.38, it could be in the run towards breaking new yearly highs.

4 hour chart depicting TRX in a downward channel

The price action of TRX on the four hour time frame seems to be a lot more bearish as it has already formed a downward channel pattern. TRX showed signs of bearish divergence after the price action made higher highs whereas oscillators such as RSI and MACD formed a consolidation range.

Currently, the price of TRX is hovering below key EMA levels which are acting as resistance. Along with that, the bearish crossover between the 20 EMA (yellow) and 50 EMA (red) is demonstrating no signs of reversal.The 100 EMA (green) has already been tested as resistance is expected to do the same again. A swing below the 100 EMA would expose the support level of the 200 EMA(blue).
The supertrend indicator has already flashed a sell signal on this chart. RSI is hanging in the 45 range illustrating a no trend signal.
CONCLUSION : The fact that TRX has broken out of a 3 year resistance at $0.092 suggests that this altcoin rally could lead TRX in exploring new ATHs. For the time being, TRX is in a bearish case scenario but it won’t last long and we will soon see the token taking support at the resistance level of $0.09. Bouncing on this particular level would make the price action of TRX even more solid.
SUPPORT : $0.10 and $0.11
RESISTANCE : $0.092 and $0.17

Nancy J. Allen is a crypto enthusiast, with a major in macroeconomics and minor in business statistics. She believes that cryptocurrencies inspire people to be their own banks, and step aside from traditional monetary exchange systems. She is also intrigued by blockchain technology and its functioning. She frequently researches, and posts content on the top altcoins, their theoretical working principles and technical price predictions.


