
 Home
Home News
News
- BCH started to fall after the recent 52 weeks high of $1208 and found a support zone near $700-$750
- Currently, the coin is trading above the 50 EMA, which is above the 200 EMA, implying the uptrend is intact.
- The BCH/BTC pair is trading at 0.015750 with an intraday loss of 5%

BitcoinCash price fell after consistently making higher highs and creating a new 52-week high of $1208; currently, it is holding above 50 and 200 EMA in the daily timeframe. The volume over the daily chart is also good. After a sharp selloff, a new support zone is observed between $700-$750. The live Bitcoin Cash price today is $751.08 with a 24-hour trading volume of $8,308,614,439. Bitcoin Cash is down 19.04% in the last 24 hours. The live market cap of BCH is $14,057,553,457.

Fallout Of Descending Triangle
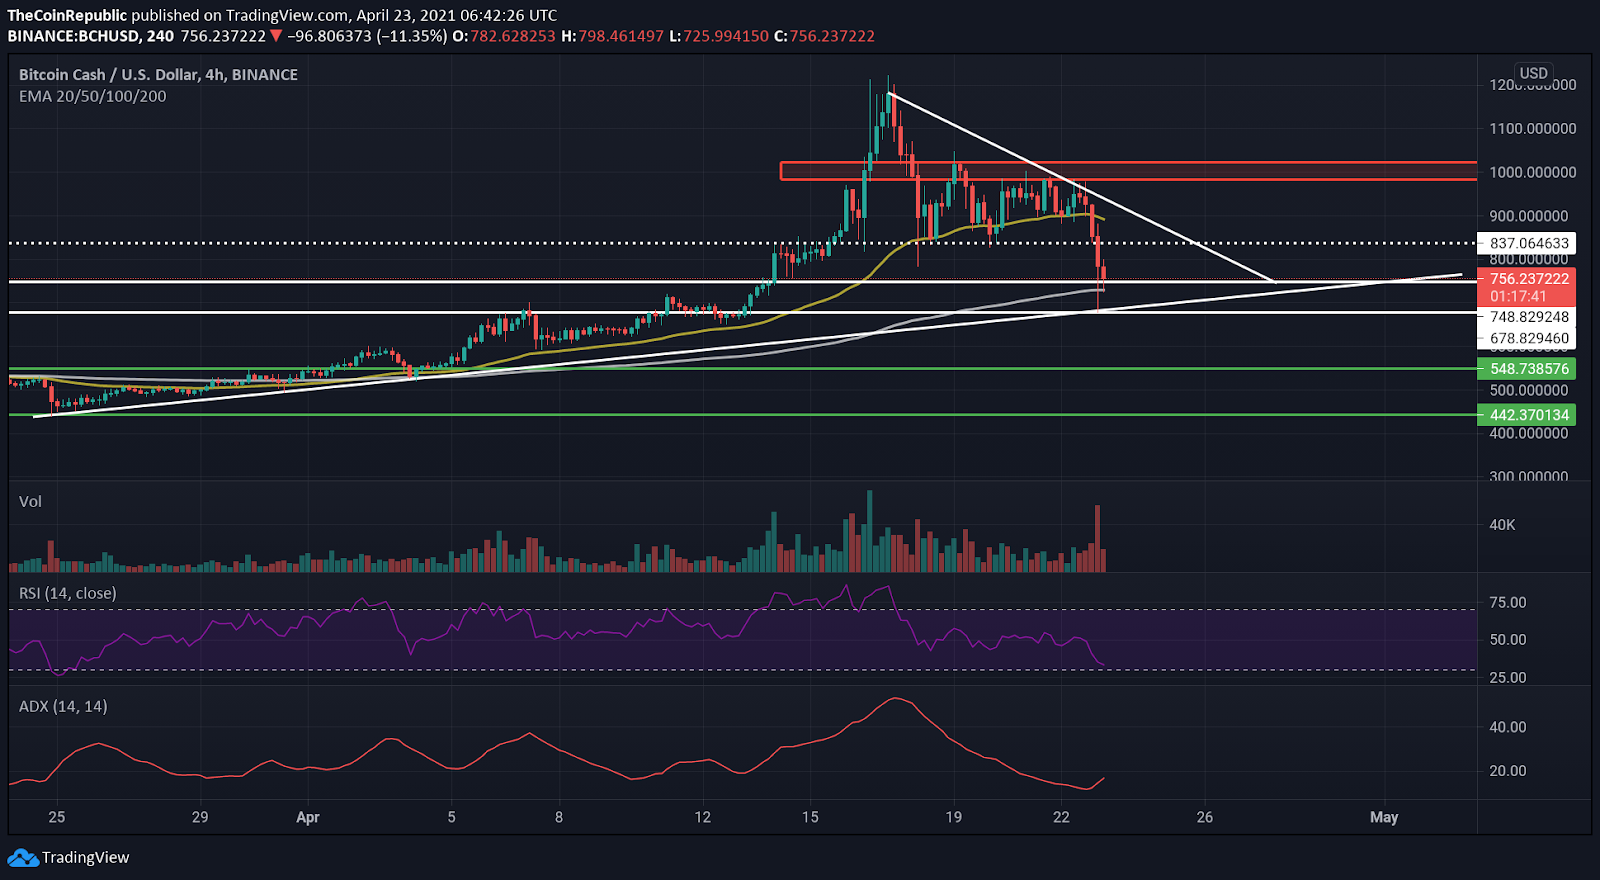
BCH had made a descending triangle pattern in the 4-hour timeframe after rejection from a 52-week high level. BCH coin price had a fallout of this level recently. A short-term pullback is expected to give a retest for the fallout. The coin price has fallen 19% in the last 24 hours. A support trendline has pushed the price back up; however, a resistance trendline is also observed. The level of $748 is the immediate support, whereas the immediate resistance zone is near $1000.

The coin price finds support near the 200 EMA (white) as the price trades below the 50 EMA (yellow). The 50 EMA is above the 200 EMA in the 4-hour timeframe implying an uptrend.
The RSI (Bullish ) indicates bullish momentum while trading at 35. However, after a sharp slope down, BCH is now heading towards the overbought zone.
The ADX indicates a gaining momentum as it is trading at 15 while the spike in ADX is increasing, implying a positive growth of momentum.
Conclusion – BCH coin price has recently showcased a fallout of descending triangle pattern indicating a start of a downtrend. A short-term pullback is expected to give a retest. Support from 200 EMA and long tails near support levels could push back the price, so early traders must wait for retest confirmation.
Support- $748
Resistance- zone near $1000

With a background in journalism, Ritika Sharma has worked with many reputed media firms focusing on general news such as politics and crime. She joined The Coin Republic as a reporter for crypto, and found a great passion for cryptocurrency, Web3, NFTs and other digital assets. She spends a lot of time researching and delving deeper into these concepts around the clock, and is a strong advocate for women in STEM.


