
 Home
Home News
News

- Litecoin price is now looking ready for another bullish rally, as it reclimbed the essential short term moving average of 20-day
- Currently, LTC is trading successfully above all moving averages of 20,50,100 and 200-Day, but volume is below average line
- The pair of LTC/BTC is trading under pressure at the level of 0.004659BTC with an intraday loss of -3.50%
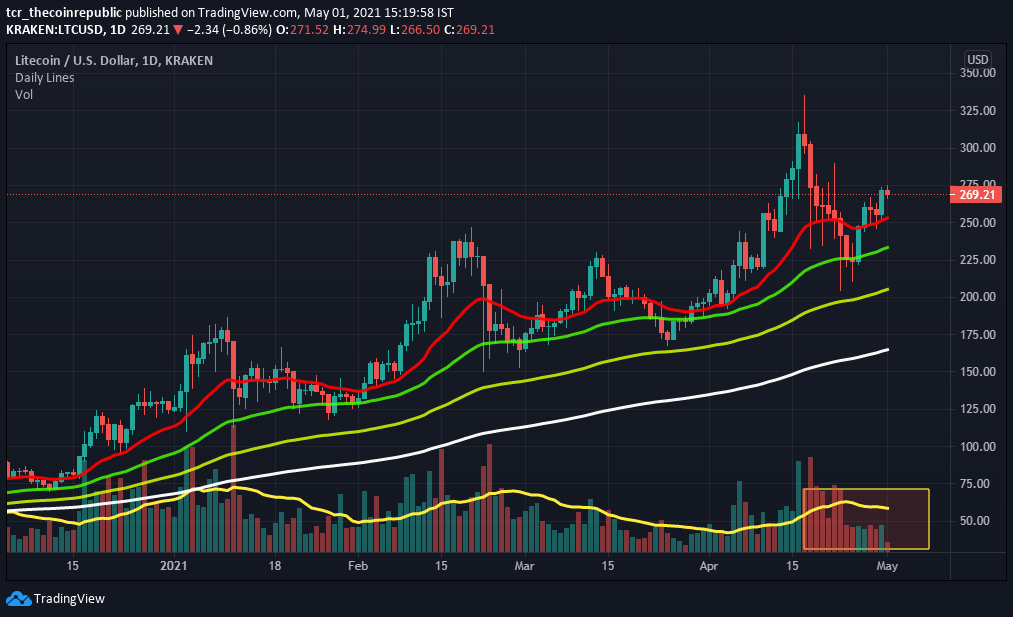
Litecoin price now shows a sign of another bullish rally and can move towards $300 soon. Since the overall chart pattern is very bullish over the yearly chart, LTC moves with higher high and lower low patterns. Moreover, a strong trend line is also acting as rising support, and every dip is to be utilized as a buying opportunity.

However, some volume over the monthly chart is also seen as it below the average line. After a sharp selloff, a new support zone is observed between $200-$220 respective; likewise, the strong support can be considered $170. Similarly, on the higher side, resistance is situated at $290 and $335.

Technical Indicators of LTC
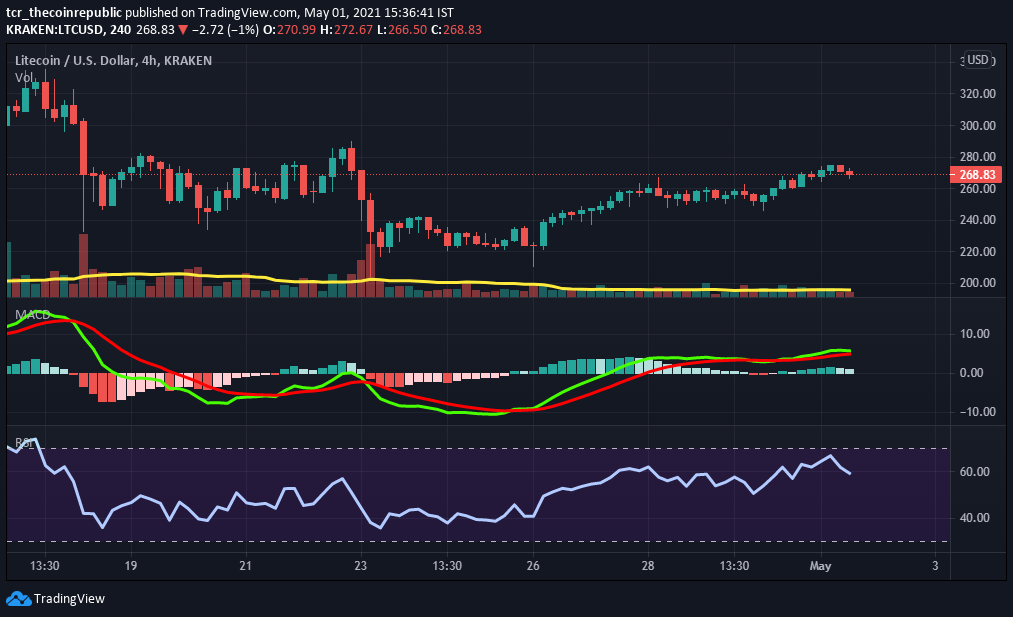
Litecoin price over the 4-hour time frame is slowly extending gains. While, in the current scenario, LTC seems to be in an uptrend but with no strong momentum. Simultaneously, short-term profit-taking is expected from higher levels.
Presently LTC is trading at the price levels of $268 with intraday gains of +1.46%, and volume increased nearly +4.47%, standing at $3,857,129,746. Likewise, the total market capitalization increased by +1.78%, standing at $17,968,646,147 on the 11th rank.
Relative Strength Index (BEARISH) indicates bearish momentum for intraday. At the same time, trading at the level of 59.62. However, after a slow recovery, LTC is now again heading towards the oversold zone.
Moving Average Convergence Divergence (BEARISH) currently indicates a bullish trend on the daily chart, as it is trading with the significance of the seller’s line (red) over the buyer’s signal line (green). However, an LTC is on the urge of negative crossover as both lines heading closer to each other.
Support levels: $220 and $200
Resistance levels: $290 and $335.
Mr. Pratik chadhokar is an Indian Forex, Cryptocurrencies and Financial Market Advisor and analyst with a background in IT and Financial market Strategist. He specialises in market strategies and technical analysis and has spent over a year as a financial markets contributor and observer. He possesses strong technical analytical skills and is well known for his entertaining and informative analysis of the Financial markets.


