
 Home
Home News
News

- Bitcoin cash price fails to hold the physiological mark of $1000, whereas the price divergence with volume is also observed
- BCH is currently trading above all the critical moving averages of 20,50,100 and 200-Day, and 50-DMA is acting as support
- The pair of BCH/BTC is trading under pressure over the daily chart, standing 0.01728 BTC with a minor loss of -0.09%
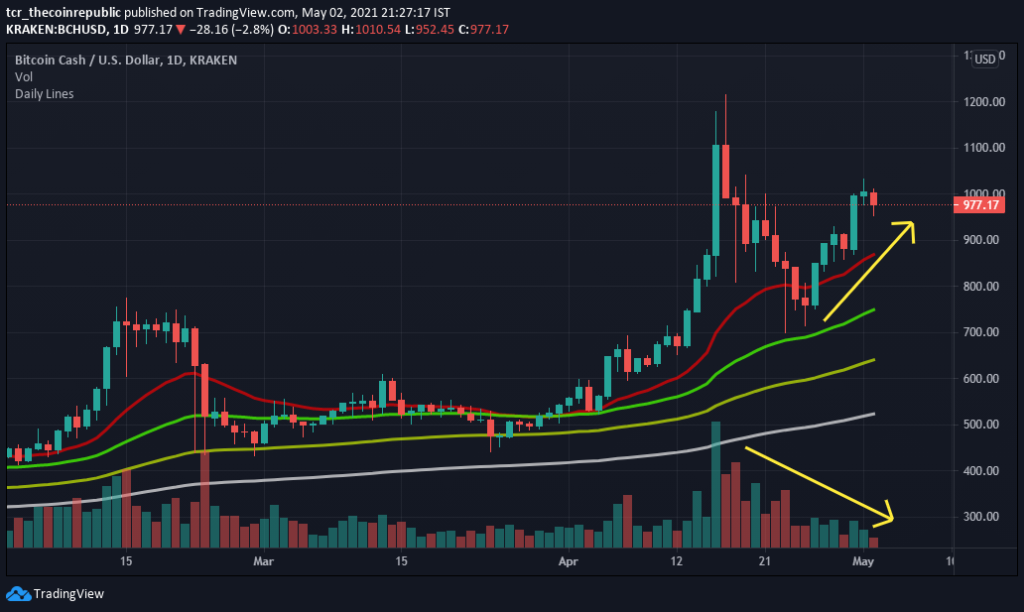
Bitcoin cash price fails to hold the mark of $1000; after a sharp recovery from lower levels, BCH made a high of $1035. However, a divergence with the uptrend is also observed, where volume is continuously decreasing concerning the price action.

Currently, BCH is sustaining above all significant and essential moving averages of 20,50,100 and 200-DMA. However, the volume activity seems lower as the volume falls below the moving average line. Support on the lower side is $820 and $700, respectively, while resistance on the higher side is $1050 and $1210.

Bitcoin Cash Price in Uptrend
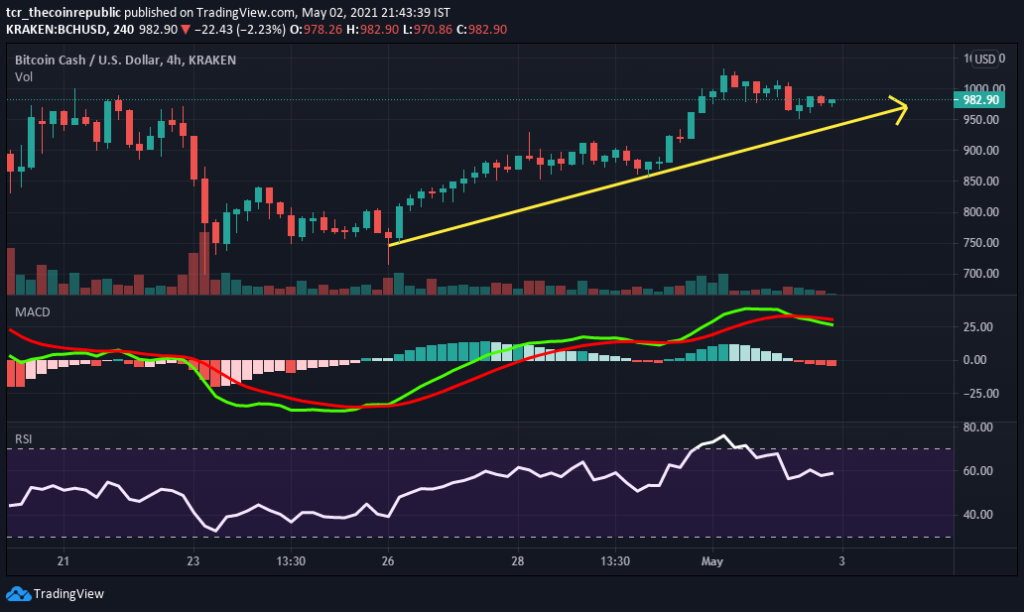
Over the daily chart, Bitcoin cash price after the formation of double bottom pattern an uptrend is followed with support by the rising trend line. BCH currently trades at $982 with an intraday loss of -2.27%. Similarly, volume also decreased by -25.40%, standing at $2,876,066,015. Meanwhile, the total market capitalization stands at $18,328,373,150, with an intraday correction of -1.17%. Support for the intraday is placed at $940 and $860, while resistance at $1050 and $1120.
Relative Strength Index (BULLISH) indicates bullish momentum while trading at 58.62. However, after a sharp recovery, BCH is now trading near the overbought zone.
Moving Average Convergence Divergence (BEARISH) currently indicates a bearish trend on the daily chart, as it is trading with the significance of the seller’s line (red) over the buyer’s signal line (green). However, both the lines are just about to give positive crossover, which will support bullish momentum.
Support levels: $820 and $700
Resistance levels: $1050 and $1210.
Mr. Pratik chadhokar is an Indian Forex, Cryptocurrencies and Financial Market Advisor and analyst with a background in IT and Financial market Strategist. He specialises in market strategies and technical analysis and has spent over a year as a financial markets contributor and observer. He possesses strong technical analytical skills and is well known for his entertaining and informative analysis of the Financial markets.


