
 Home
Home News
News

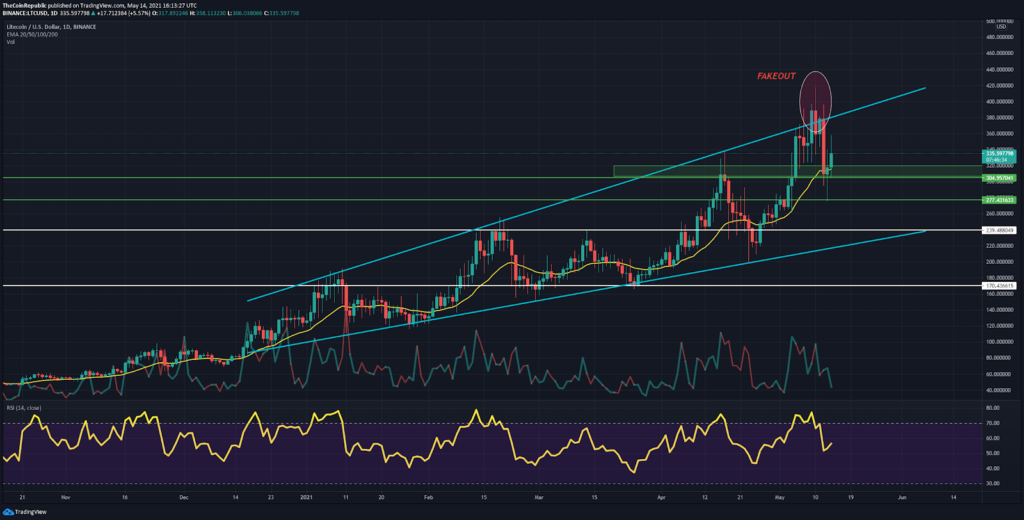
- LTC/USD bounced from a low of $292 to a high of $336 all within the short span of 24 hours
- The LTC/BTC pair is currently trailing at 0.0065 BTC with a gain of 5.79% at press time
- Amsterdam-based Technical analyst suggests LTC is following ETH’s footsteps.
The widespread sell-off of LTC in Thursday’s intraday session on account of the Tesla CEO’s decision to stop accepting BTC as payment had led the coin to the tank by 10%. The price action of LTC has been constricted inside the ascending broadening wedge pattern since the beginning of this year. However, the trend was interrupted in a fake-out event that assisted LTC in establishing an ATH of $417 on May 10th. At present, the price of LTC is trading at a crucial resistance zone from where it has faced rejection back in April. According to pivot points, the $305 level has been placed as a significant support zone. LTC’s incapacity to sustain above this range would expose the 20 EMA as temporary resistance.

The LTC/BTC chart on the weekly time frame is demonstrating a possibility of a massive breakout towards the upside, which could plummet the asset to its 2019 gains.

A bounce back from the 0.5 FIB extension would be an ideal situation for LTC
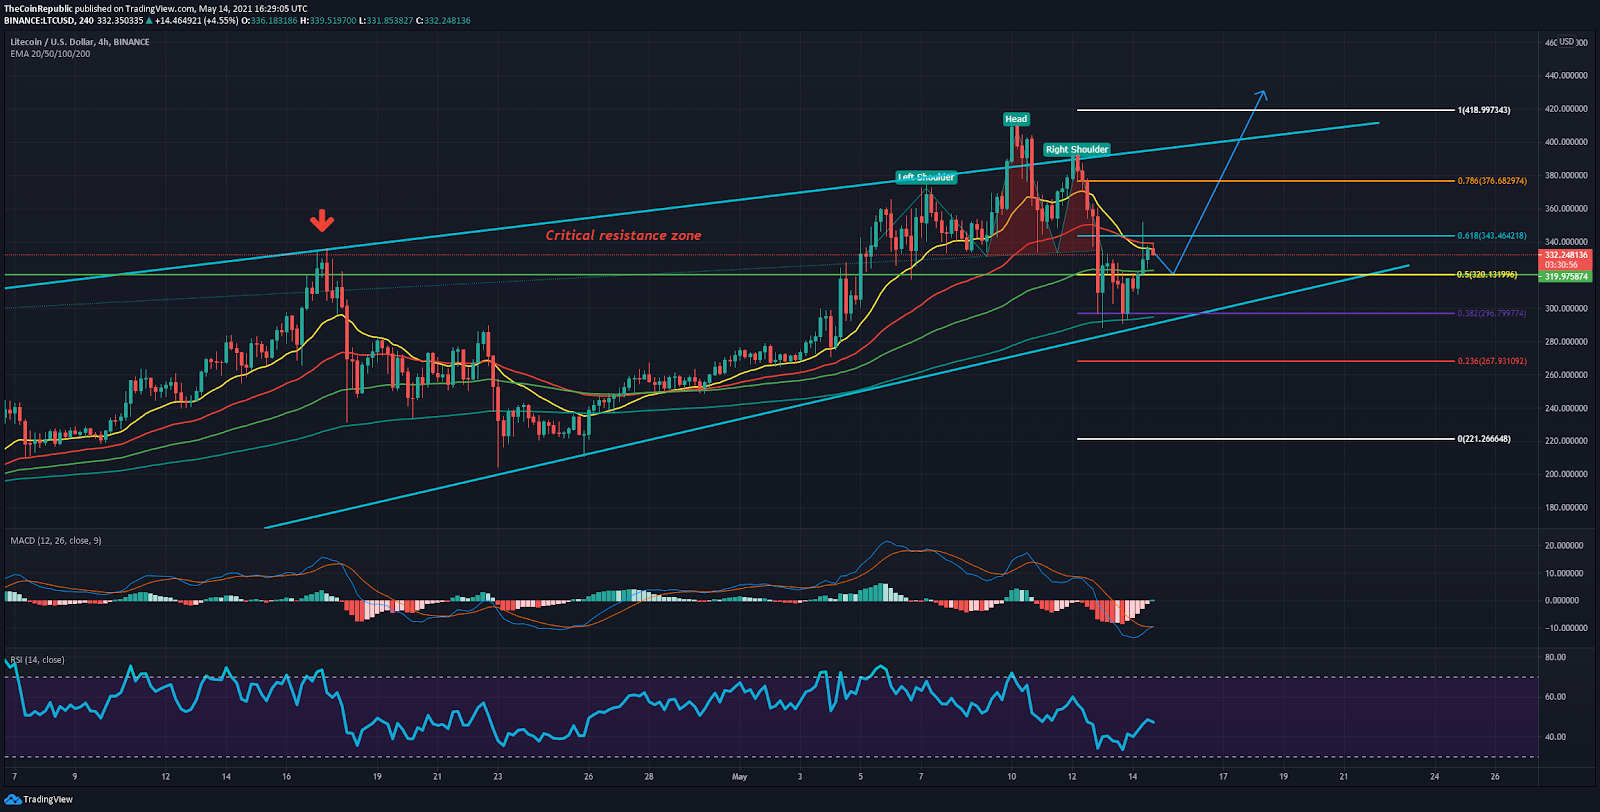
As mentioned above, LTC is currently trading at a strong resistance level from where a rejection at this point is imminent on account of a bearish crossover between the 20 EMA (yellow) and the 50 EMA (red). While the 20 and 50 EMAs are providing temporary resistance to the coin, the 100 EMA (green) is in confluence with the 0.5 FIB at $320. A rebound from this particular level would also uphold the cup and handle pattern which could drive the price of LTC to explore new targets.
The RSI (slightly bullish) is depicting a no trend scenario as suggested by its entry into the equilibrium zone after spending hours in the oversold territory.
On the contrary, MACD (bullish) is about to flash a bullish crossover which will be evident once the histogram exhibits a bullish trend.
Amsterdam based Tech Analyst suggests a striking comparison between LTC and ETH
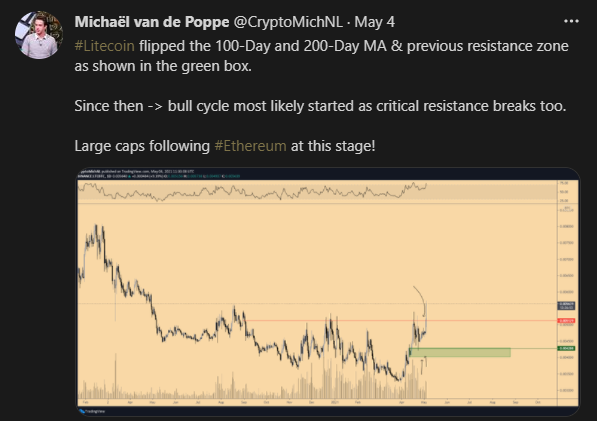
In addition to it, he also highlighted that it’s only a matter of time until Litecoin completely follows Ethereum. He often tweets posts about the striking comparison between LTC and ETH’s previous performance. If this statement holds any value, Litecoin could be the next altcoin to gain the spotlight after Etherium.
SUPPORT : $305, $320
RESISTANCE : $334 , $417

Nancy J. Allen is a crypto enthusiast, with a major in macroeconomics and minor in business statistics. She believes that cryptocurrencies inspire people to be their own banks, and step aside from traditional monetary exchange systems. She is also intrigued by blockchain technology and its functioning. She frequently researches, and posts content on the top altcoins, their theoretical working principles and technical price predictions.


