
 Home
Home News
News

- LINK accelerated from a low of $25.08 to a high of $33.04 in Wednesday’s intraday session
- The LINK/USD pair is trailing at 0.0007718 with a gain of 14.5% at press time
- The current price of LINK is $30, established on the back of a 14.23% increase in the last 24 hours.
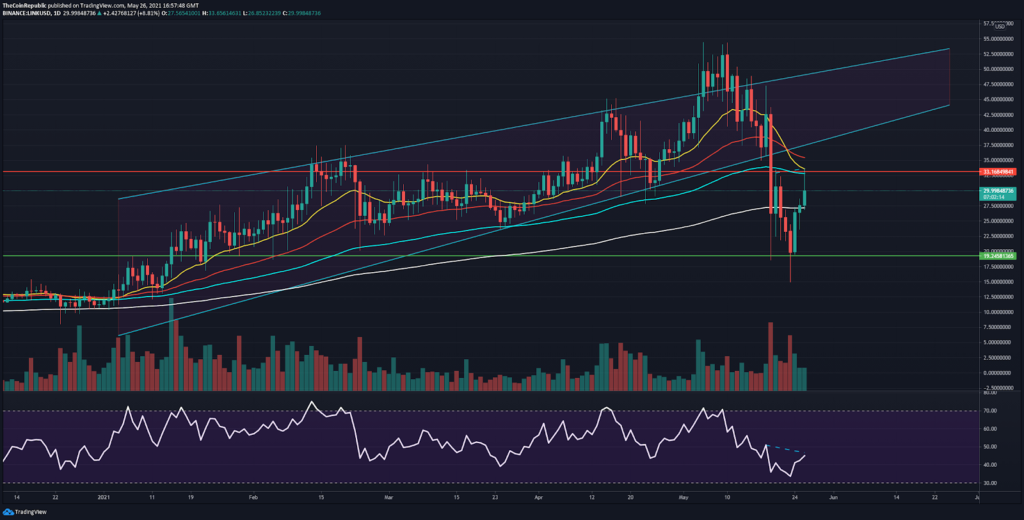
The daily chart of LINK highlights that the coin is currently sitting at the peak of this week’s correction cycle.

At present, LINK is hovering at a critical resistance zone at $30.73. This particular level is acting as a major confrontation territory, as evidenced by last week’s bull rally. It is anticipated that today’s upswing might catch a break at the present-day price level on account of short-term profit booking.

The above statement can be reinforced by the fact that the EMA’s have dictated a bearish crossover. The 20 EMA has already entertained a crossover with the 50 EMA and is still in the run to approach the 100 EMA. In such an event, the price of LINK will revisit the lows of Sunday at $19.24.
The daily Relative Strength Index is levitating in the equilibrium zone after displaying minor bearish divergence.
LINK 4-hour chart is implying Inverse Head and Shoulder Pattern
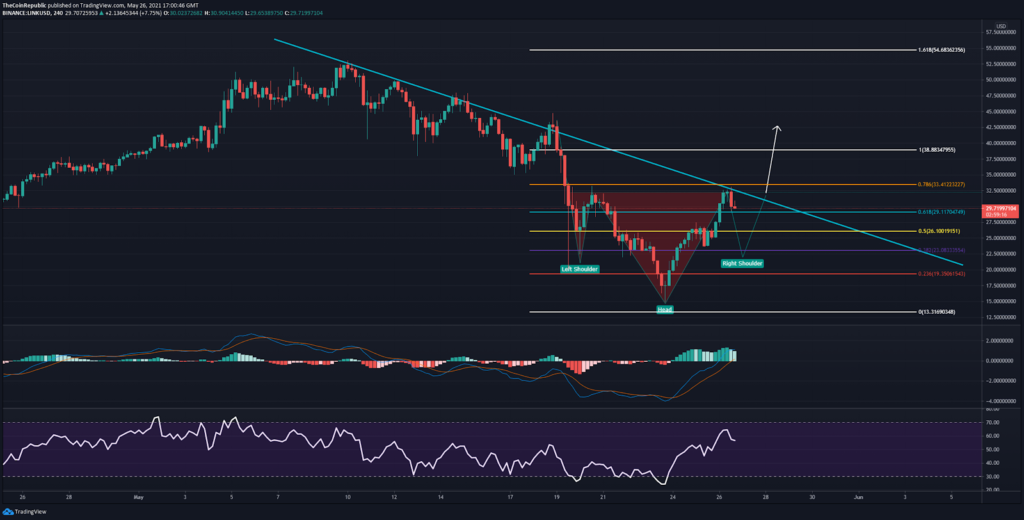
The 4- hour chart adds volume to the fact that a short term bearish trend is very likely in the upcoming days. It appears that the price action on the 4-hour chart is in the midst of a bullish reversal pattern known as the inverse head and shoulder.
The chart has dictated the beginning of a minor setback which can cause the price of LINK to plunge to $23.22( FIB 0.236). However, in case the bulls disrupt the trend, speculators can expect a bounceback from $27(FIB 0.382). Nevertheless, a temporary bearish outlook for LINK remains intact. If the above prediction holds accountability, LINK can catch an upswing of $32% in the near term.
On the contrary, a breach of the resistance trend line can contradict the above statements and invalidate the bearish outlook.
The technical indicators have devised a sell signal as demonstrated by the Moving Average Convergence Divergence ( MACD histogram) getting exhausted from lingering in the oversold territory.
The Relative Strength Index, on the other hand, is gradually heading towards the overbought territory. Although an RSI of 57 is not necessarily overbought, traders can expect sharp price fluctuations.
CONCLUSION: LINK needs to soar by 80% to breakeven at its recent ATH of 54.65. The SuperTrend indicator stands by the Buy signal, which suggests that even if LINK undergoes a minor dip, the overall trend is still bullish. The price action of LINK has entertained a ‘V shaped’ recovery, thus demonstrating the fact that Bulls have gained the upper hand.
Investments in cryptocurrencies are subjected to market risks. Investors should conduct their due diligence before investing.
SUPPORT : $23.22, $27
RESISTANCE : $30

Nancy J. Allen is a crypto enthusiast, with a major in macroeconomics and minor in business statistics. She believes that cryptocurrencies inspire people to be their own banks, and step aside from traditional monetary exchange systems. She is also intrigued by blockchain technology and its functioning. She frequently researches, and posts content on the top altcoins, their theoretical working principles and technical price predictions.


