
 Home
Home News
News

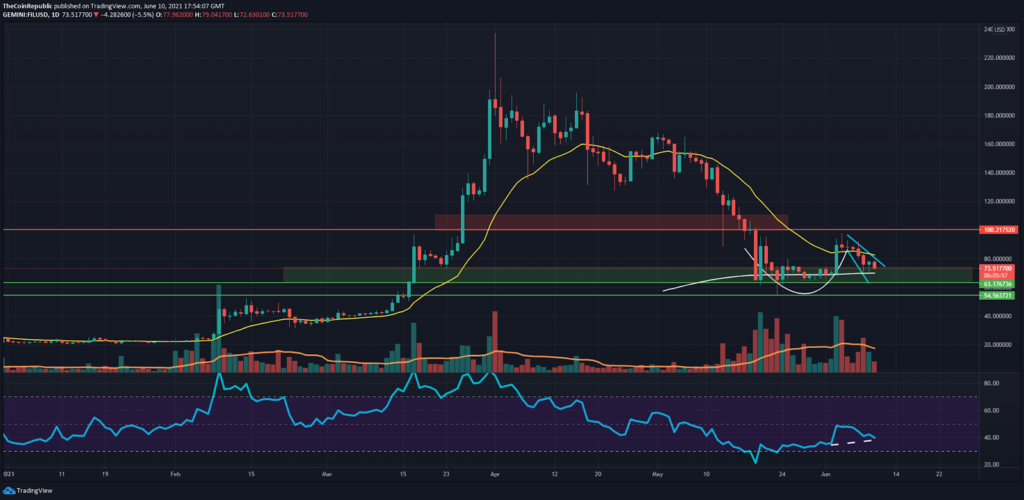
- FIL Token on the daily chart is restricted between the 20 and 200 EMA
- FIL bounced from a high to $78 to a low of $73 to witness losses worth 5.44% in today’s intraday session
- In contrast, the FIL/BTC pair is trailing at 0.001998 BTC with a loss of 5.43% at press time
Subsequent to the freefall from the supply region of $100, FIL seemed poised for a rally. However, the token witnessed another corrective wave of 18% which prevented the prevalence of the bulls.

The daily technical chart of FIL token pays attention to the fact that the token is currently facing strong hindrance by the 20 EMA. While the 200 EMA has proved its consistency is serving as support, a break from the current price level would validate the bullish cup and handle pattern and grant FIL an exit ticket from the critical resistance of $100.

On the flip side, the failure of FIL to hold the 200 EMA as support will make the token vulnerable to the bears and expose the support of $54.
The Daily RSI seems to be in favor of a bullish trend as evidenced by the minor resurgence displayed on the oscillator. The RSI is maintaining neutral bias inside the equilibrium range after displaying a minor case of divergence ahead.
The volume of (47.65 K) is considerably lower than the volume of (109.18 K) the 20-period moving average, The decline in volume highlights the brink of an impulsive wave ahead. Having said that, no trade setups should be considered until the current trend of FIB breaches the 20 EMA.
According to the coinmarketcap website, Filecoin is presently ranked #23rd with a market capitalization of $5.7 Billion
FIL Token Technical Chart on the 4-hour time frame
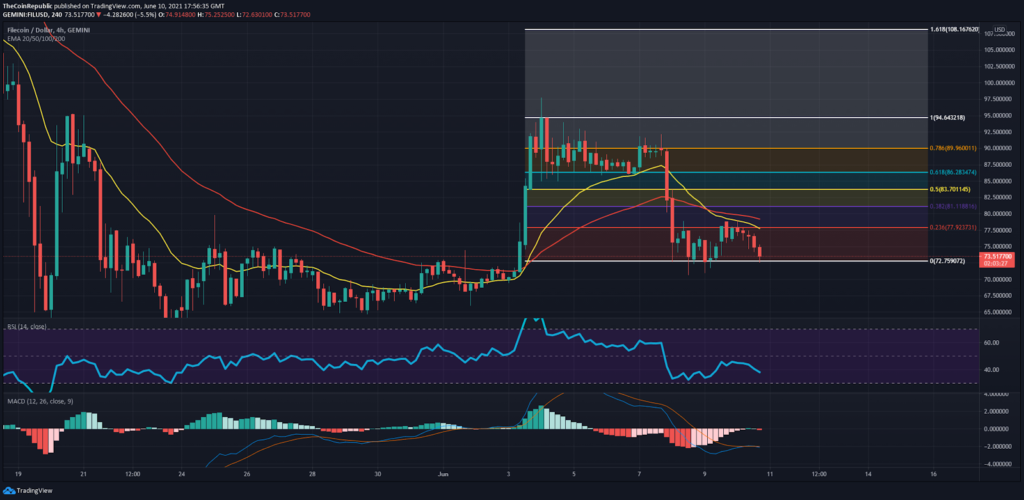
The 4-hour technical chart of FIL token highlights the fact that the token maintains a steady momentum exactly halfway. FIL has departed from 22% of its recovered gains and is currently sitting at a high of 22% from the fatal drop.
While continuing a bearish bias, FIL has re-inspected the support of FIB 0 at $72. A breach above the bearish FIB 0.0236 FIB retracement would easily open the doors towards the 0.5 FIB at $83.
While FIL coin has plunged back to its three-week low, the technical indicators are hinting that it’s time for a reversal. The Moving Average Convergence Divergence is at the cusp of entertaining a bullish crossover but is facing pressure by the MACD line. The failure of the histogram to shift inside the positive territory demonstrates that a temporary bearish trend is intact.
CONCLUSION: The fact that FIL has only recovered by 22% since last month’s bloodbath highlights that it’s time the token headed for a reversal. While FIL is poised for a rally, the technical indicators are temporarily against it.
Investments in altcoins are subjected to market risks and Bitcoin Dominance. Investors should conduct their due diligence before investing.
SUPPORT : $54, $72
RESISTANCE : $83, $100

Nancy J. Allen is a crypto enthusiast, with a major in macroeconomics and minor in business statistics. She believes that cryptocurrencies inspire people to be their own banks, and step aside from traditional monetary exchange systems. She is also intrigued by blockchain technology and its functioning. She frequently researches, and posts content on the top altcoins, their theoretical working principles and technical price predictions.


