
 Home
Home News
News

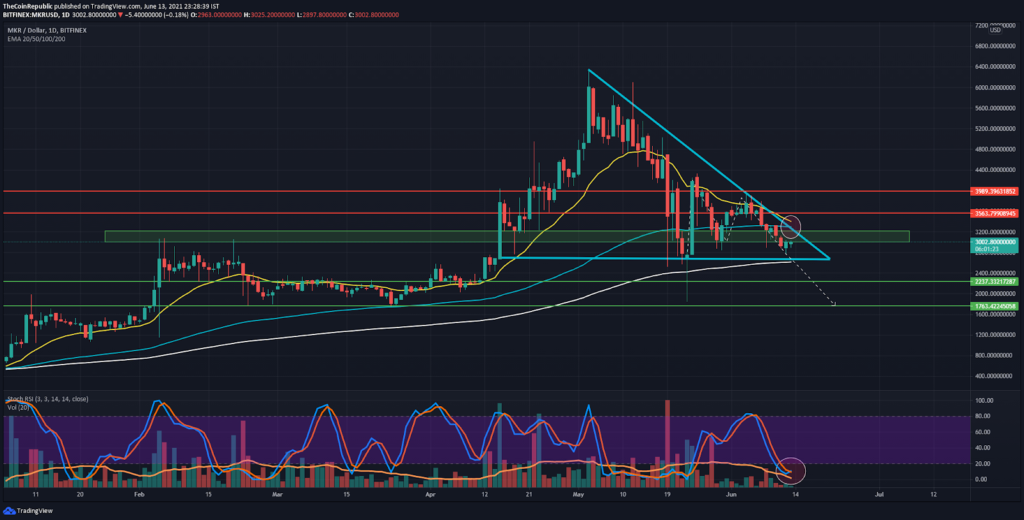
- MKR token on the daily chart is attempting towards a reversal as evidenced by the bullish cross on the Stochastic RSI
- The current price of MKR is $2992 established on the back of a 1.73% increase in the past 24 hours
- In contrast, the MKR/BTC pair is trailing at 0.8039 BTC with an intraday loss of 3.06% at press time
The daily technical chart of MKR forecasts a bearish bias on account of the price action losing the critical support level of $3220.

While the current trend of MKR is heading towards a reversal, a rejection from the overhead resistance of $3205 will stimulate the price action the validate the double top pattern.

A breach of the $2880 support level, which is presently serving as the neckline of the bearish pattern, will further cast a decline of nearly 11% in the short term.
The 20 EMA on the other hand is intending to approach the 100 EMA. The success of the bearish crossover between these critical EMAs will grant MKR an exit ticket from the descending triangle pattern. Having said that, speculators can expect the 200 EMA to serve as a support barrier.
According to the coinmarketcap website, MKR is ranked #33rd on the Global Crypto Currency rating while enjoying the market dominance of merely 0.19%.
MKR Price Chart on the 4-hour time frame
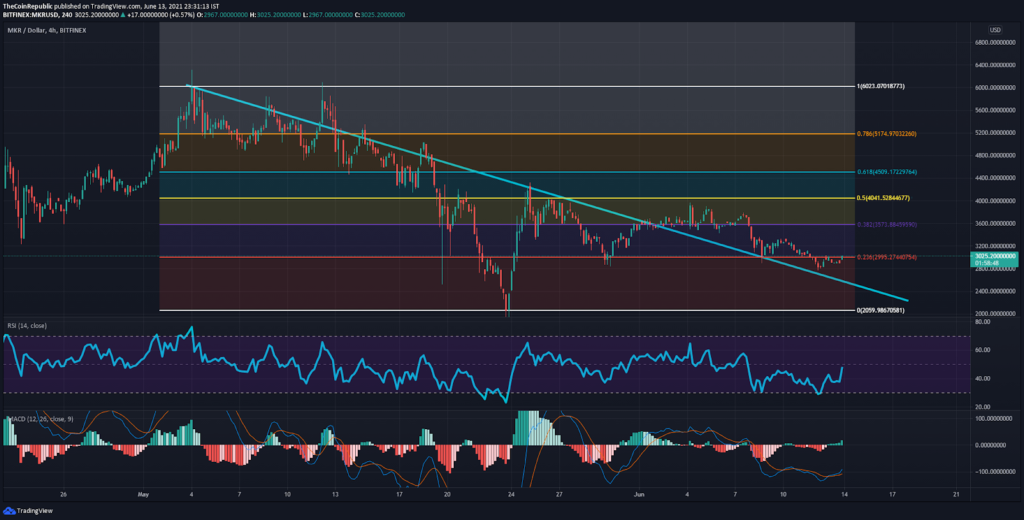
The 4-hour chart of MKR highlights the fact that the asset is currently approaching the bearish 0.0236 FIB retracement which lies at $2995. A rejection from the above level can enable MKR to re-visit the macro support trend line.
After surging by 90% in a bear market owing to May’s bloodbath, MKR’s price trend is engaging inside the rangebound territory. Sitting at the $2992 level, MKR is at an elevation of 47% from its 52 week low.
The 20 EMA is presently acting as a hindrance to the token while invalidating efforts of the bulls to push the price above 0.0236 FIB level. A decisive close above the 20 EMA will lay the ground for a 5% upswing in the short term. The chances of MKR to defeat the 20 EMA is very unlikely as the RSI trend is bolstered with minor bearish divergence.
The overall trend of MKR is heading towards a deeper correction despite the fact that the price action has flipped the macro resistance line into a support barrier.
The RSI is fixating inside the equilibrium range at 48 after dictating a minor case of bearish divergence ahead. The MACD on the other hand is projecting weakness despite the worthwhile efforts of a bullish cross between the MACD line and the signal line.
CONCLUSION: MKR is maintaining its bearish bias while trading below critical EMAs on all time frames. A double top pattern can validate MKR to stumble across the $2337 support level. With the Crypto Volatility Index flashing 77, traders should trade with caution and steer clear of the bearish cross between the 20 and the 100 EMA on the daily chart. A reversal can only be confirmed once MKR breaches the 0.5 FIB which lies at $4041.
Investments in altcoins are subjected to market risks and extreme price volatility. Investors should conduct their due diligence before investing.
SUPPORT : $2742, $2880
RESISTANCE : $3205

Nancy J. Allen is a crypto enthusiast, with a major in macroeconomics and minor in business statistics. She believes that cryptocurrencies inspire people to be their own banks, and step aside from traditional monetary exchange systems. She is also intrigued by blockchain technology and its functioning. She frequently researches, and posts content on the top altcoins, their theoretical working principles and technical price predictions.


