
 Home
Home News
News
- The 24 hours trading volume of the token is 371,335,581 and the low of 35.12% was seen. The live price of XLM is $0.237
- The token has been showing the pattern of three black crows.
- The RSI oscillator for XLM shows the NEUTRAL action.
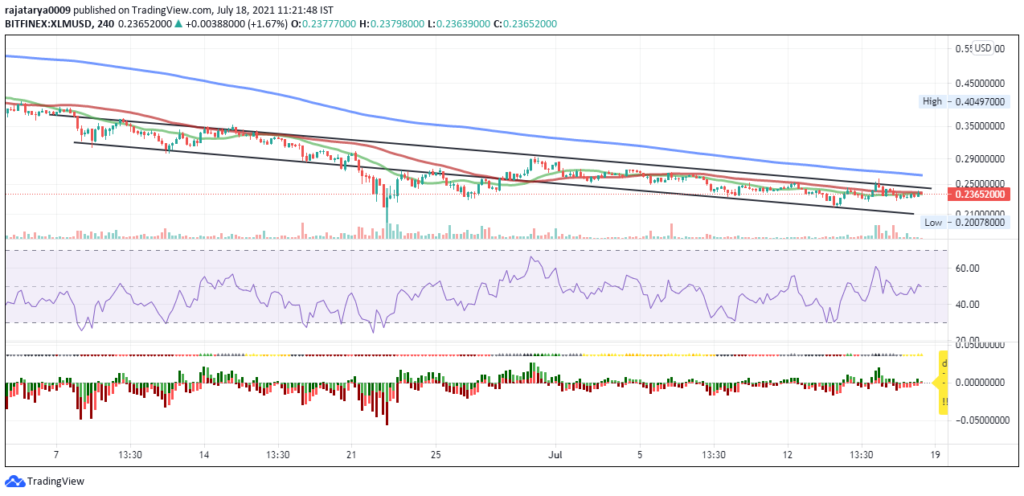
The STELLAR has been running well below its 200 days moving average and also below its 50 days moving average. The chart above shows the movement of the token with respect to SMA-20, SMA-50 and SMA-200. The token was unable to touch SMA-200 but SMA-50 was achievable at times. The trendline marked in the chart shows the movement of SMA-20 above and below SMA-50 and so the returns were approximately 10-12% in this zone. The market is bearish and the gradual fall in price is continuing.

An RSI oscillator is also present in the chart which shows the proper time to buy or sell the token. RSI for the last 5 hours shows the value of 49.113 and marks the neutral action. MA-5, MA-10 and MA-20 show the buy action but MA-100 and MA-200 show sell action. However, the XLM at present is all set to buy as the token is trailing below to the other two SMA. It is expected to show a hike in price in the coming time.

The bull/bear power has the value of 0.0045 and shows the buy action. The high/low marks the neutral action with the value of 0.00.
The XLM-BTC pair is trailing at the level of 0.00000739 and the low of 0.63% was seen whereas the XLM-ETH pair is trailing at the level of 0.0001198 and the low by 3.59% was seen in the last 24 hours. The token has shown the percentage change by 0.96% since yesterday’s open.
The volume/market cap of the token is 0.06726 and its market dominance is 0.42%.
Conclusion: The days range for the coin is 0.23000-0.24020 and presently is at 0.23680. The token is expected to show rise in the coming time and if you wish to purchase this token then long it as SMA-20 is below SMA-50 and 200. The candles have sustained at $0.23000 and it is expected to cross SMA-50 in the next two days.
Technical Instruments:
Pivot: 0.23600
R-1: 0.23883
R-2: 0.24057
S-1: 0.23317
S-2: 0.23143
(Note- The unit is USD)
Note:
- The unit is USD
- SMA-20: Green colour
- SMA-50: Red colour
- SMA-200: Blue colour

Andrew is a blockchain developer who developed his interest in cryptocurrencies while pursuing his post-graduation major in blockchain development. He is a keen observer of details and shares his passion for writing, along with coding. His backend knowledge about blockchain helps him give a unique perspective to his writing skills, and a reliable craft at explaining the concepts such as blockchain programming, languages and token minting. He also frequently shares technical details and performance indicators of ICOs and IDOs.


