
 Home
Home News
News
- The IOTX price retest the neckline of a strong bullish pattern
- The IOTX/BTC pair was trading at 0.000002043 BTC with a gain of 34.7%
- The 24 hr trading volume in IOTX is $965.5 Million, indicating a 675.3% hike

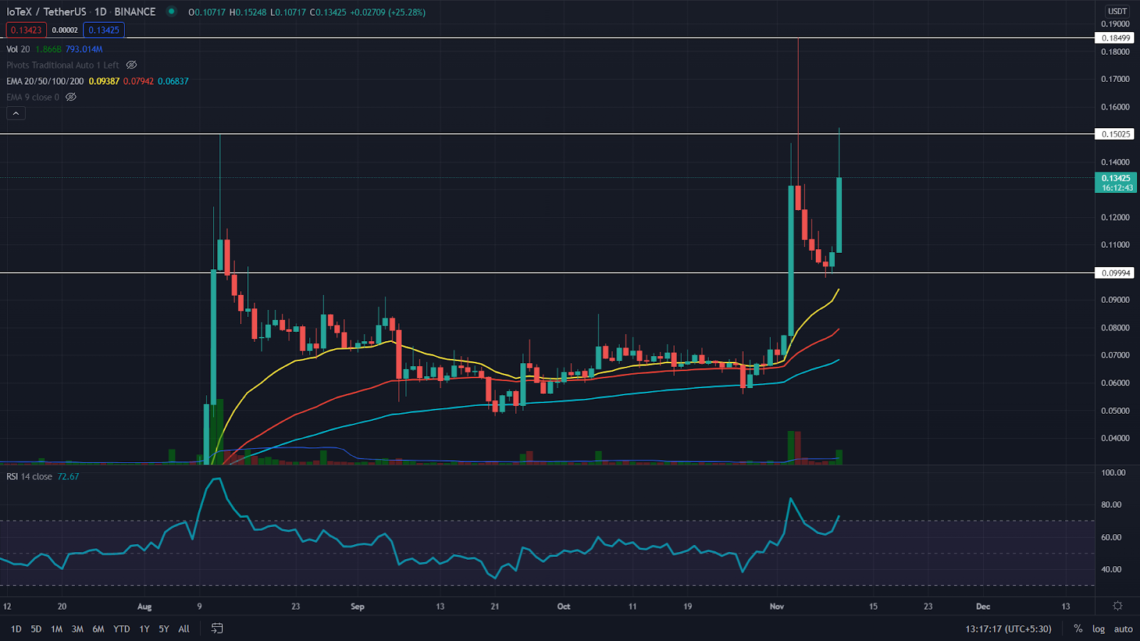
The IOTX coin chart reveals an excellent opportunity for crypto investors with the formation of a Cup and Handle pattern in the daily frame. This pattern has a $0.15 neckline as its key resistance, and the price has just retested this resistance level. Therefore, the crypto traders should wait till the price provides a decisive breakout from the overhead resistance to trigger an entry opportunity.

The IOTX coin’s price is trading higher than the EMAs 20, 50, 100, and 200, indicating a strong bullish trend.

The RSI value(BULLISH) stands at 72, indicating a bullish sentiment about the price movement.
The IOTX Coin Chart In The 4hr Time Frame
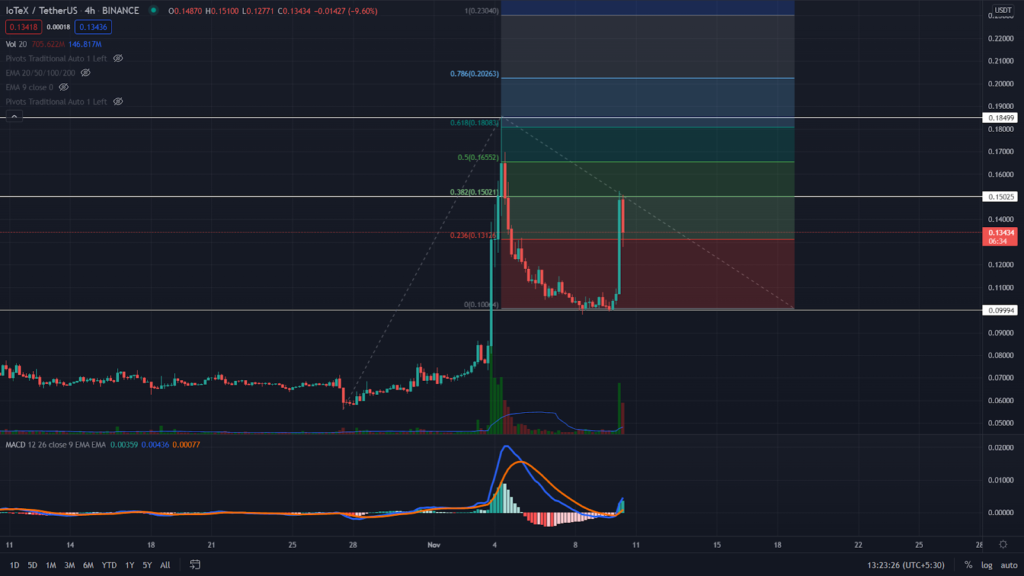
The IOTX coin showed a sudden price surge in its intraday session, displaying a long green candle with a 25% gain. However, the coin is currently facing some rejection from the $0.15 resistance mark, testing the patience of the coin buyers.
However, if the price managed to break out from the overhead resistance, the Fibonacci extension indicates the $0.165 mark as the nearest resistance level allowed by the $0.18 and 0.2 mark.
The moving average convergence/divergence indicator (BULLISH) shows both the MACD signal line and MACD line have just crossed above the neutral zone, indicating bullish momentum for this coin.
Conclusion: From a technical perspective, the overall trend for IOTX coins is strongly bullish, indicating a good place for trend traders seeking long entry opportunities.
As mentioned, the coin price also shows a Cup-and-handle pattern in its technical chart, and these traders should wait for a daily candle to close above this $0.15 neckline to confirm a proper breakout.
Support– $0.13. $0.1
Resistance– $0.15


