
 Home
Home News
News
- ZEC fell from $305 after making a bearish head and shoulder candlestick pattern in a daily time frame.
- ZEC is testing its very crucial support level that is $141.1.
- ZEC/BTC pair price is positive today by 0.56% at 0.003161 BTC.
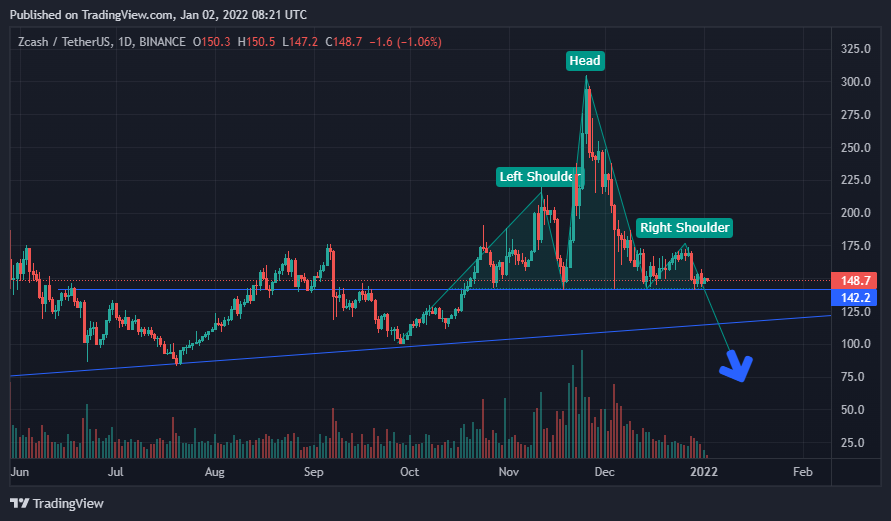
ZEC’s price came in a selling pressure after hitting $305 on 25 November, and the sellers had come into existence by which they made a grip on the bearish trend.

Nowadays, ZEC is trading in a sideways tragedy after slipping from $305; now, it clearly shows the bearish head and shoulder pattern in a daily time frame. With this, it is trading on a crucial support zone that is becoming weak because ZEC tested it much time, and it can breach it soon.

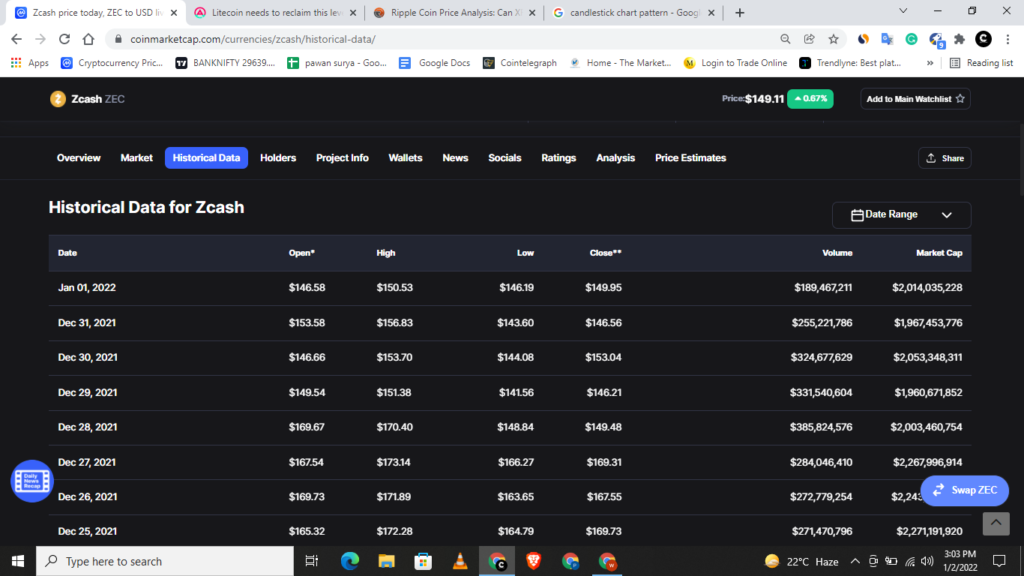
ZEC’s price is trading in the green zone by 0.67% at $149.11. And the last 24-hour trading of $190 million. Today there is an enormous volume difference in comparison to other days. It is a 24.39% drop down in the last 24 hours. From 28 December 2021, volume is decreasing gradually.
Will ZEC continue its downtrend, or bounceback from here?
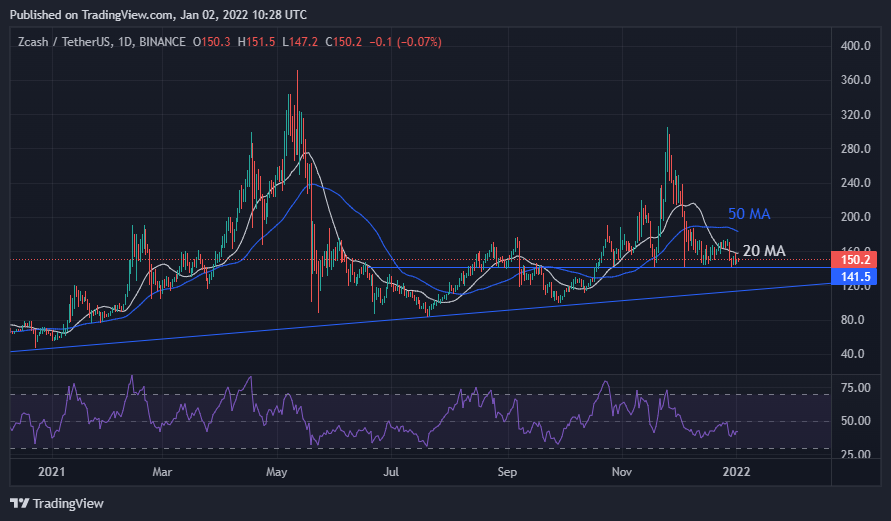
ZEC coin has been following the upwards trendline for a long time. Whenever it comes near this trendline zone, it takes support and bounces back from there. But considering the decrease in volume, ZEC may breach this trend line after hitting its crucial support level.
Relative Strength Index (RSI) showing 42 level which seems like the consolidation phase of ZEC for the short term trading session. RSI turned the flip side after selling, but again it is struggling with the bearish trend.
ZEC coin is appearing bearish now because it is below 20 Moving Average (MA) and 50 moving Average (MA) now, and for a bullish trend, ZEC Coin’s will have to grapple with these two moving averages with strong buying potential.
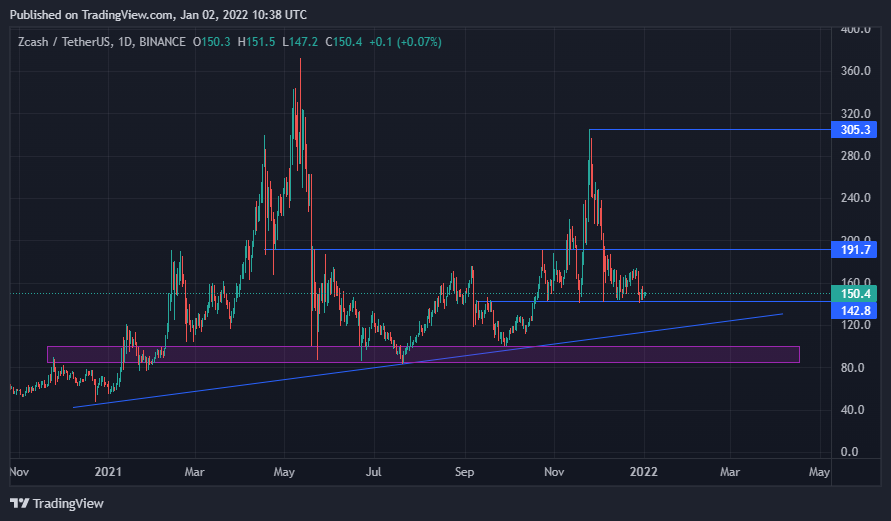
As we can clearly see, ZEC coin is trading on a pivotal support level. If it breaks this to the next Support level will be $100 to 80. On the other hand, the resistance levels are $191 and $305 for the long-term time period.
Conclusion
ZEC coin seems in a sideways phase for a short-term time period until it breaks its range. But at this price level, the sellers have a strong grip on-trend as compared to buyers, so if the coin breaks this support level, then it may test the next support level.
Support level- $80-$100
Resistance level- $191-$305
Disclaimer The views and opinions stated by the author, or any people named in this article, are for informational ideas only, and they do not establish financial, investment, or other advice. Investing in or trading crypto assets comes with a risk of financial loss.
Steve Anderson is an Australian crypto enthusiast. He is a specialist in management and trading for over 5 years. Steve has worked as a crypto trader, he loves learning about decentralisation, understanding the true potential of the blockchain.


