
 Home
Home News
News

- BCH Coin Price broke out of a crucial long-term support zone
- The coin is showing bullish momentum on both the time frames
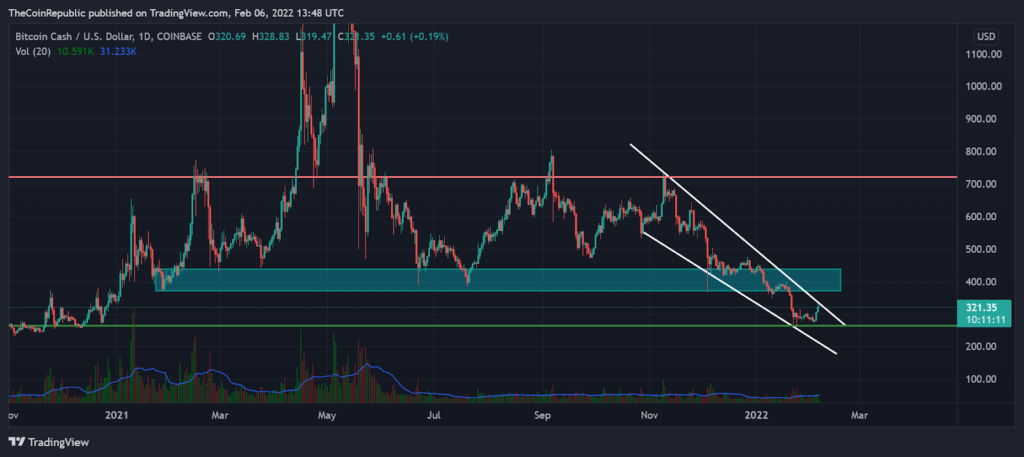
BCH Coin Price broke out of a crucial support zone and has taken new support at $ 266. The coin is currently testing the resistance trendline currently. It remains to be seen over the next few days if the coin is able to get back into the support zone it broke out off. The coin has been bullish over the last few days and looks set to break the resistance of the bearish channel.

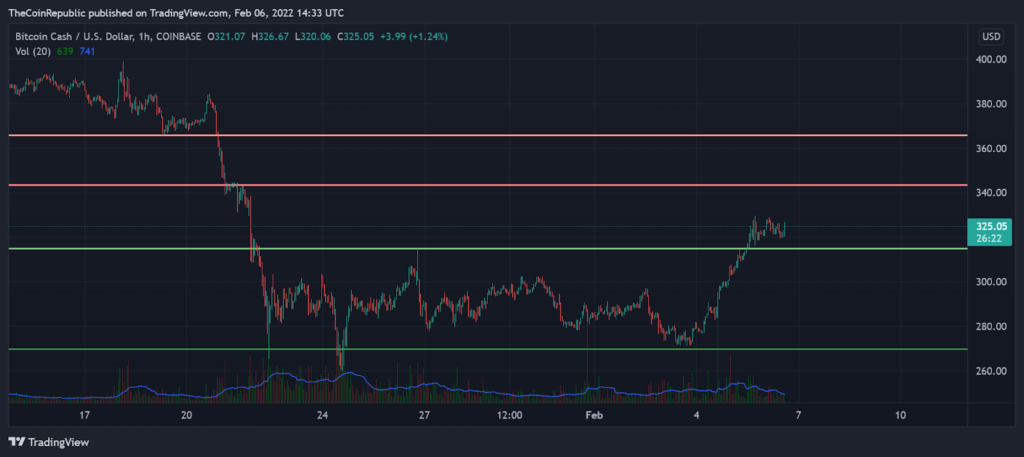
BCH Coin Price has broken a short-term resistance and is currently trading in the zone of $ 343 and $ 315. The coin has formed strong support at $ 269. The coin has been receiving heavy volumes over the last few days before the breakout from the short-term support.

Conclusion:
BCH price has been on a bullish trend over the last few days. Traders can look out for crucial support and resistance zones and place their trades accordingly. The volumes on the hourly chart have been coming in well.
Support: $ 269
Resistance: $ 343
DISCLAIMER: The views and opinions stated by the author, or any people named in this article, are for informational ideas only, and they do not establish any financial, investment, or other advice. Investing in or trading crypto assets comes with a risk of financial loss.

With a background in journalism, Ritika Sharma has worked with many reputed media firms focusing on general news such as politics and crime. She joined The Coin Republic as a reporter for crypto, and found a great passion for cryptocurrency, Web3, NFTs and other digital assets. She spends a lot of time researching and delving deeper into these concepts around the clock, and is a strong advocate for women in STEM.


