
 Home
Home News
News

- CELSIUS Token price is trading along the short term supply supply zone and is trying to give breakout.
- The Token is showing v-shaped recovery on the weekly chart.
- The pair of CEL/BTC is trading at 0.00007443 with a decrease of -1.4 in the market cap of the digital asset over the past 24 hours.
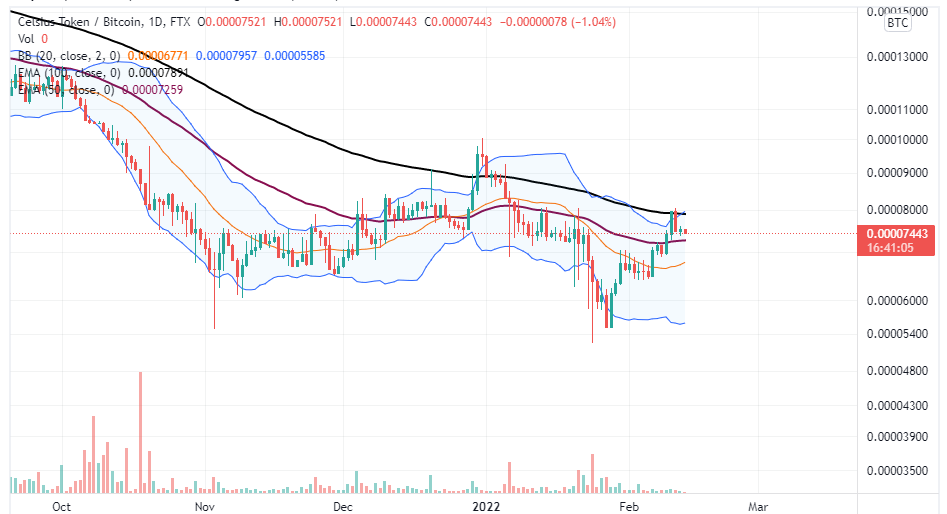
CELSIUS Token Price is trading along with the resistance after an impulse move over the last trading days and failed a breakout. The Token forms lower low and lower high formation in a daily time frame. The Token recently gave a breakout of 20 EMA, and after retesting, it breakout of 50 EMA and is now trading above it. If the Token can break out of $3.5, it will result in a structural change. The Token has yet to break out of the 100 EMA and can face rejection moving upwards. The Token is trading at the upper band of the Bollinger band indicator and thus can face rejection, resulting in the token price falling to a short-term demand zone of $2.4.Due to fewer volumes, it will become difficult as the bears will overpower bulls, resulting in the price of a digital asset to trample down.Volumes have decreased over the last trading days, despite the V-shaped recovery.

ALSO Read – 2022 WOULD WITNESS A SPIKE IN CRYPTO RANSOMWARE PAYMENTS
CELSIUS Token is getting bullish signs of the technical parameters

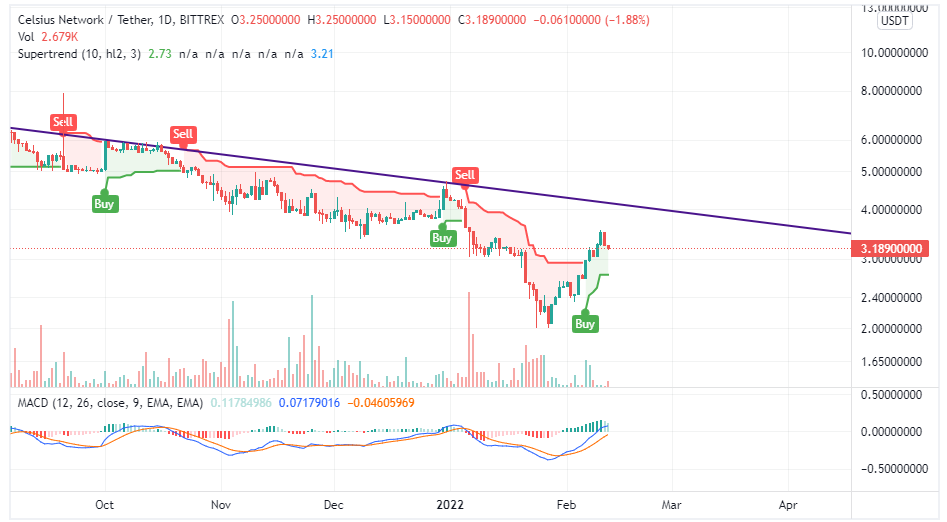
CEL Token price is moving in downtrend from the past couple of trading days and recently it tried to break out of short term supply zone at $3.4.But bears immediately shut down the bullish momentum by forming bearish candle.it remains to see if the candle is retest or a short term bearish trend.
Moving Average Convergence Divergence (Bullish): MACD indicates a bullish trend on the daily time frame as it gave a positive crossover. The buyer’s signal line(blue) crossed the seller’s signal line (orange) on the upside, indicating a possible breakout of the long-term supply zone at $3.5, which can help the coin price move up to $4.5 with strong momentum.
Supertrend: Recent bullishness in the price of the Theta token led to a V-shaped recovery, and now it has resulted in a super trend indicator giving a buy signal. The Token was facing rejection of supertrend at $3.02, and it gave a breakout of it with a strong green candle. Thus, indicating a bullish moment in the upcoming days in the price of the underlying asset.
CELSIUS Token is showing bullish divergence on daily timeframe
The token price is showing bullishness on the RSI curve, despite the fall in the price of digital assets the RSI curve is not moving down.Indicating a false down move to trap investors.
Average Directional Movement Index: ADX curve, despite the fall in the price of the token was at peak which is worrying signs. As now, the rise in the price of the digital asset is not reflected in the ADX curve, as it is seen dipping.Currently, the ADX curve is at 30.48 .
CONCLUSION: Despite the breakout of the short term supply zone the token is showing bearish signs on various timeframe.Technical parameters suggests the same.It remains to see if the token is move up at long term supply zone $5.2 or bears take control and trample the price down to $2.1
SUPPORT: $2.1 and $2.3
RESISTANCE: $5.2 and $5.4
Disclaimer
The views and opinions stated by the author, or any people named in this article, are for informational ideas only, and they do not establish the financial, investment, or other advice. Investing in or trading crypto assets comes with a risk of financial loss.

Andrew is a blockchain developer who developed his interest in cryptocurrencies while pursuing his post-graduation major in blockchain development. He is a keen observer of details and shares his passion for writing, along with coding. His backend knowledge about blockchain helps him give a unique perspective to his writing skills, and a reliable craft at explaining the concepts such as blockchain programming, languages and token minting. He also frequently shares technical details and performance indicators of ICOs and IDOs.


