
 Home
Home News
News

•FLUX/USD is currently priced at $1.55 and is down by 1%over the past day

•The trading volume of FLUX has reduced by 6.18% over the past day

•The technical indicators suggest the bearish momentum to continue
Short term view: Flux looking to shake off the bears
The Flux price today is $1.55 USD with a 24-hour trading volume of $23,937,231 USD. Flux coin is down 1% in the last 24 hours. With markets mainly in the red on Saturday, finding a coin that withstood the storm was no mean feat. However, FLUX has managed to evade the bearish pressure which led to it losing only a minute proportion of its value. The trading volumes were down from the past 24 hours,while the Volume to Market Cap Ratio stands at 0.06018.
ALSO READ – BUTERIN CLAIMS STIFLING THE USE OF BANK ACCOUNTS AND CRYPTO IN CANADA PROTESTS DANGEROUS
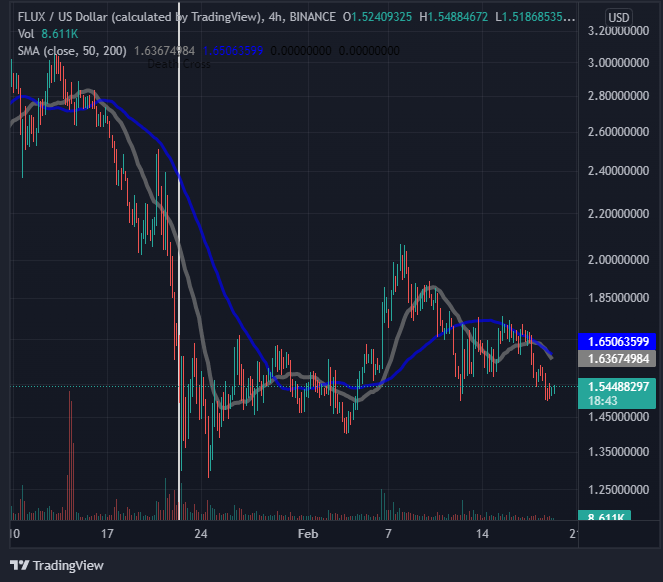
December 10,2021 marked the all time high for the coin as it reached $4.17. A series of corrections since,however, has taken the shine of it’s value. It is currently in the midst of a downtrend, with Flux trading below the 20 and 50 SMA on the 4 hour chart. Flux coin is potentially trading inside a parallel channel and is facing short term resistance at $1.68. The neckline or support, on the other hand, lies at $1.46.
Long term View
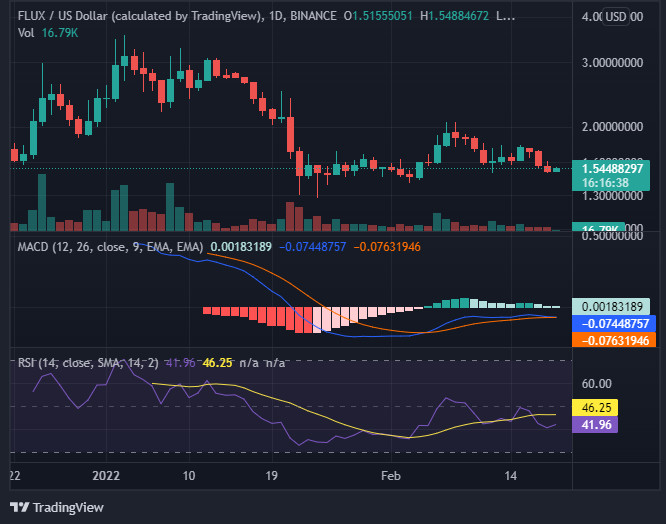
The technical indicators for Flux coin suggest the bearish sentiment to prevail in the short term ,which could see the coin continuing to move downwards. The RSI indicator stands in the neutral territory at 41.96,which suits the bears perfectly for the near term. The MACD on the other hand, shows a bearish crossover about to happen which would further the cause of the bears. The weakening histograms strengthen the hands of the bears as they look to assert their dominance on the market.
Conclusion
The technical indicators for Flux coin paint a bearish picture which is likely to see the coin continuing to move downwards. Hence the nearest resistance in this scenario, becomes of utmost importance to the bulls .If bears sink and sustain the price below the triangle, the pair could drop to below the support level. Such a fall could delay the start of the next leg of the up-move because the breakdown level from the triangle will act as a resistance during subsequent relief rallies.A failure to hold the crucial support level could result in a steep correction. However if a breakout were to occur, a potential target for the top of the movement is found at $1.68.
Support: $1.46-1.40
Resistance: $1.68
Disclaimer
The views and opinions stated by the author, or any people named in this article, are for informational ideas only, and they do not establish financial, investment, or other advice. Investing in or trading crypto assets comes with a risk of financial loss.

Nancy J. Allen is a crypto enthusiast, with a major in macroeconomics and minor in business statistics. She believes that cryptocurrencies inspire people to be their own banks, and step aside from traditional monetary exchange systems. She is also intrigued by blockchain technology and its functioning. She frequently researches, and posts content on the top altcoins, their theoretical working principles and technical price predictions.


