
 Home
Home News
News

- The Vechain coin has been downward since early December into the descending parallel channel.
- The VET coin price is retesting the pivotal support level of investors and giving the bounce-back sign.
- The VET/BTC pair price is trading bullish by 1.56% at 0.0000013 satoshis.
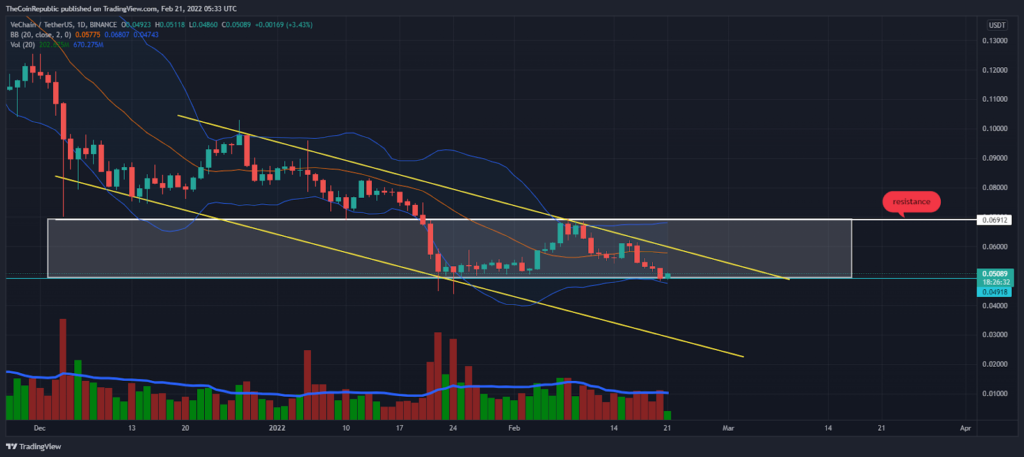
The Vechain investors have been suffering from panic selling since the all-time high level ($0.2798-mark). During the descending parallel channel, the VET coin price is retesting the crucial support level of $0.049. For the past several days, the crypto price has been consolidating into the wide horizontal range, where $0.049-support and $0.069-act as short-term resistance.

The VET investors seem to be aggressive near the support level and trying to push the price higher, resulting in the coin price is trading bullish by 3.23% at $0.0507 at the time of writing. However, the VET coin has gained 46% of trading volume over the past 24-hours. The past week’s red volume bars were more than the green volume bar, showing the bear’s dominance. The volume to market capitalization ratio is 0.08921.

The daily price chart of the VET coin is below the half-level (20-day moving average) of the Bollinger Bands indicator and reflects the reversal sign near above the lower verge of the BB indicator. Buyers may step up and push the crypto price higher.
During the downtrend, bulls are attempting to catch VET’s price
The Vechain price with the Bitcoin pair is still in the red zone of the super trend indicator and slips below the critical support level of 0.00000131 satoshis. After a solid bearish weekend, the VET/BTC pair price is trading in the bullish territory by 1.5% (positive) at 0.00000129 satoshis. The pair price is moving towards the sloping trendline (white) in the context of the daily price chart. The pair price above the declining trendline could attract buyers.
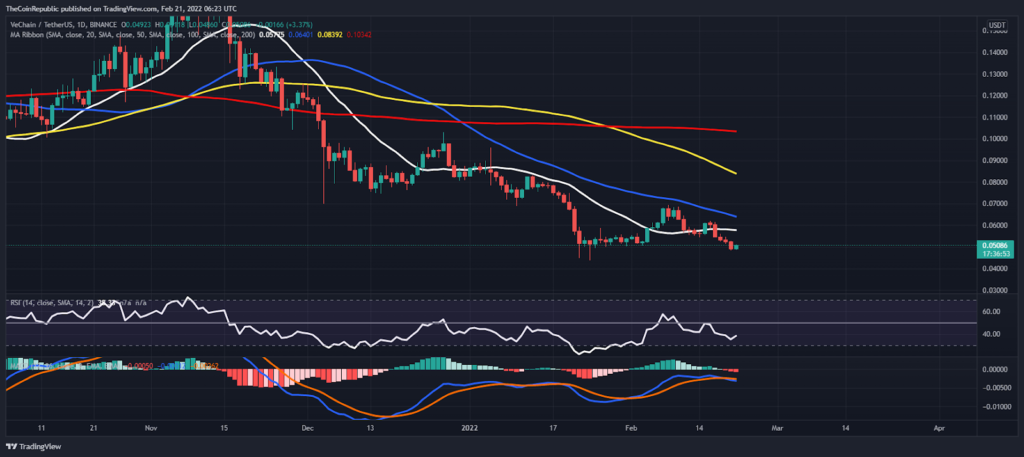
The daily price chart of the Vechain coin is below the major moving averages (such as 20,50,100, and 200 MAs). The 50-day moving average has been the red zone of volatility for a long time. We can expect bullish momentum above the 50-MA line.
The RSI is making lower highs in the daily price chart. Now the RSI is at 38-mark after turning its peak to the upside; it may reach 50-level by the end of this week. Meanwhile, the MACD indicator seems to be in sideways territory, just below the neutral level.
Conclusion
Looking at the current market scenario, the VET investors are waiting for the confirmation of trend reversal sign near the crucial support level. If bulls succeed in sustaining the price above $0.050 by the end of this week, we can expect the shorts-unwinding.
Resistance level- $0.188
Support level- $0.55
Disclaimer
The views and opinions stated by the author, or any people named in this article, are for informational ideas only, and they do not establish the financial, investment, or other advice. Investing in or trading crypto assets comes with a risk of financial loss.

Nancy J. Allen is a crypto enthusiast, with a major in macroeconomics and minor in business statistics. She believes that cryptocurrencies inspire people to be their own banks, and step aside from traditional monetary exchange systems. She is also intrigued by blockchain technology and its functioning. She frequently researches, and posts content on the top altcoins, their theoretical working principles and technical price predictions.


