
 Home
Home News
News
The hyped cryptocurrency market again showcases the high volatility. A single piece of news can affect the whole cryptocurrency market either way. The high tides and low tides at the shore of crypto investors. The last week has been fully packed, electrifying, and adventurous for crypto investors. The Crypto market exhibited a lot of volatility throughout the week.

Now moving on to the daily performance chart of the Cryptocurrency Market, which is basically a heat map signaling the daily performance of different cryptocurrencies in the intraday trading session and their market dominance. BTC’s Market dominance never went outdated, and you can see that in the below chart in the form of its impact over altcoins.

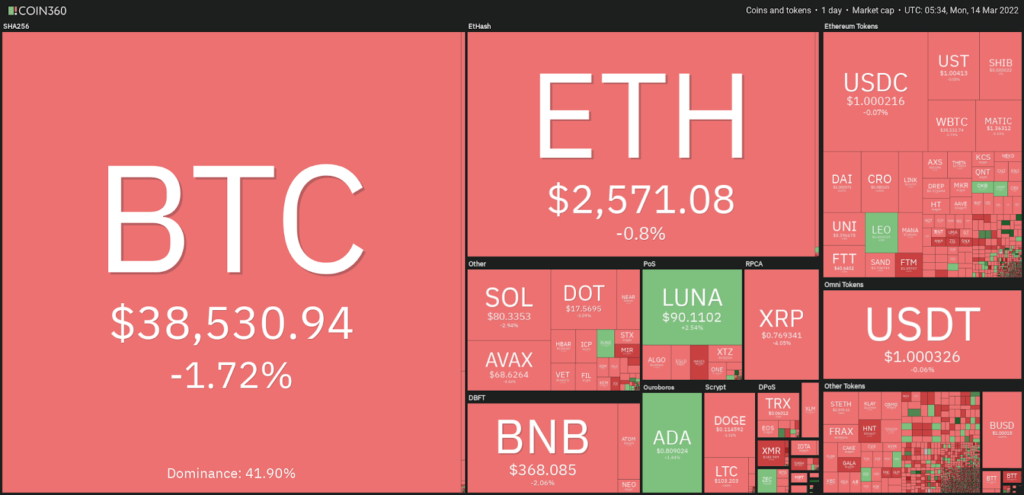
The Cryptocurrency market has shown a nail-biting performance throughout the last week. Investors got confused regarding the volatile nature of different cryptocurrencies. I have mentioned earlier also about the diamond hand and paper hands, the ones with diamond hands are always the benefited ones. On the other hand, the ones with paper hands are wise and not those who benefit all the time.
Let us move on to the technical analysis (Chart Analysis) of different cryptocurrencies like Bitcoin (BTC), Ethereum (ETH), Ripple (XRP), Dogecoin (DOGE), Shiba Inu (SHIB). This technical analysis will inform you about different chart patterns and price predictions.
BTC/USD Chart Analysis
Bitcoin (BTC) Price is trading in an interesting chart pattern: a symmetrical triangle pattern over the daily chart. Bitcoin (BTC) is presently CMP at $38,400 and has lost 1.70% of its market capitalization in the intraday trading session. However, trading volume has significantly increased by 41.39% in the last 24-hour. The volume to market cap ratio is 0.02791. The highest and lowest hits by BTC in the last 24-hour period are $38,923 and $37,560, respectively.
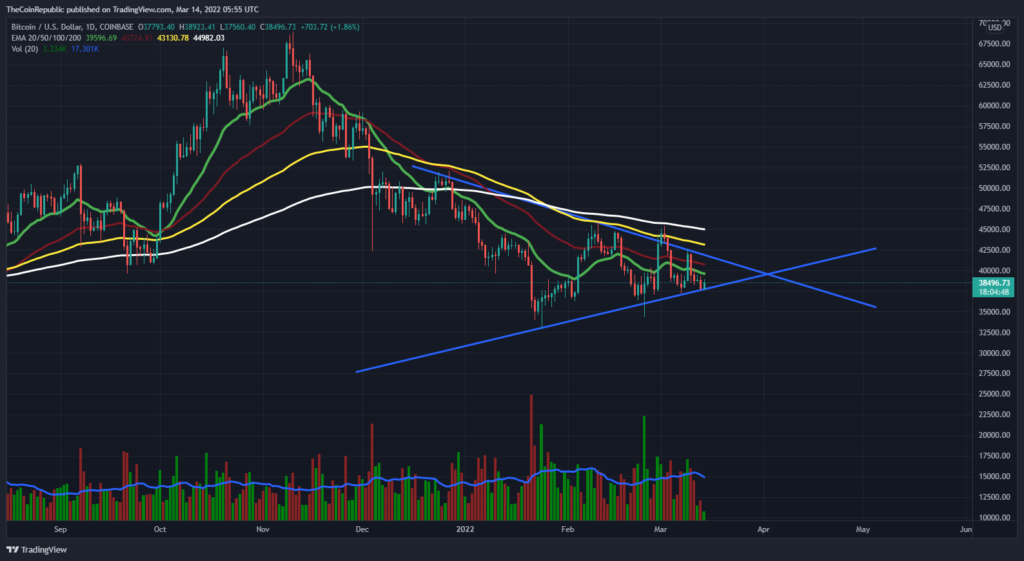
Bitcoin price is bullish inside a symmetrical triangle pattern over the daily chart. Bulls are trying to sustain at the verge of the lower trendline emerging through lower lows. However, volume change is below average and needs to grow in order to escape from the symmetrical triangle pattern.
BTC token is trading below 20, 50, 100, and 200-days Daily Moving Average. Bulls need to push their limit to let BTC escape from the symmetrical triangle pattern and regain its momentum in the intraday trading session.
ETH/USD Chart Analysis
Ethereum coin price is trading below a downward sloping line over the daily chart. Ethereum’s price is presently CMP at $2569 and has lost 0.77% of its market capitalization in the last 24-hour period. However, trading volume has significantly increased by 64.34% in the intraday trading session. This signifies the buyers are getting involved and starting the trading session with rising hopes for the recovery of the ETH coin.
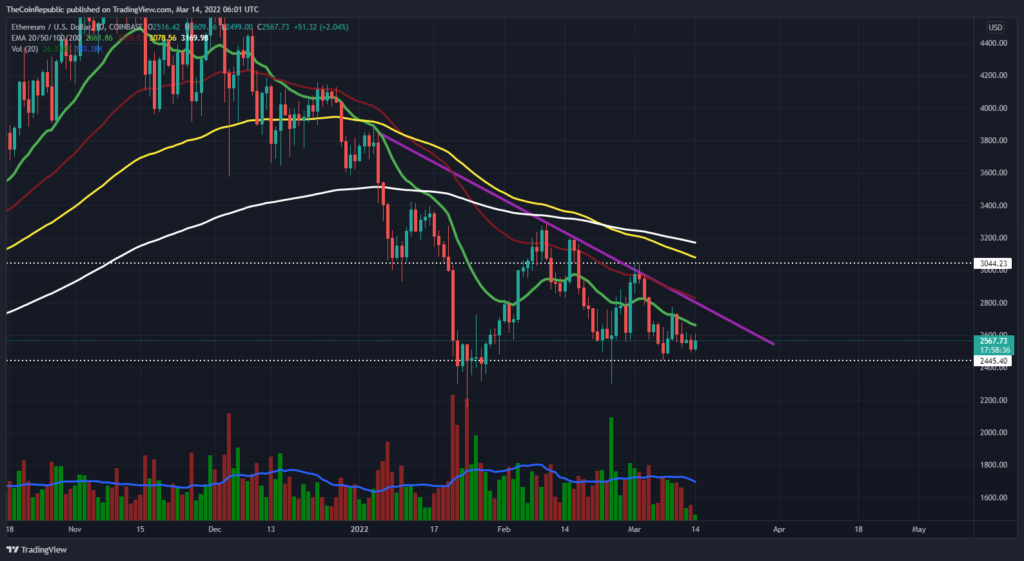
Volume to market cap ratio is 0.03357. ETH coin has been consolidating below a downward sloping line from the past few trading sessions. Bulls failed to sustain at the neckline thrice and are still faltering below the downward sloping line.
ETH price is below 20, 50, 100, and 200-days Daily Moving Average. However, trading volume over the chart is below average and needs to grow in order to gain the momentum back.
The highest and lowest hits by ETH in the last 24-hour period are $2609 and $2499, respectively. Ethereum investors need to wait for any directional change over the daily chart.
XRP/USD Chart Analysis
XRP Coin price is sideways inside a horizontal range-bound area over the daily chart. XRP coin is presently CMP at $0.76 and has lost about 3.81% of its market capitalization in the last 24-hour period. Meanwhile, trading volume decreased to 15.79% in the intraday trading session. That signifies traders are not getting involved in the trade at the moment.
XRP needs to attract more buyers to move out of the consolidation phase inside a horizontal range of $0.67 and $0.84.
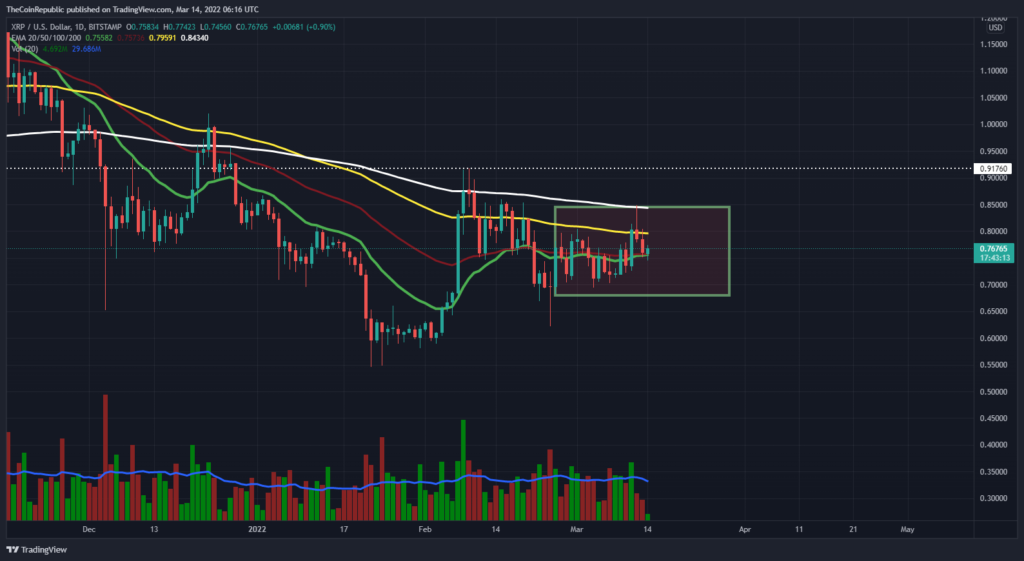
Volume to market cap ratio is 0.06159. XRP coin has been consolidating inside a horizontal range-bound area since February 25. Now it’s high time to attract more buyers and skip consolidation over the chart. XRP has recovered above 20 and 50 SMA and needs to reach upto 200-days DMA after crossing the 100 SMA, the only bullish hurdle in between.
XRP investors need to wait for a strong upward momentum and attract buyers to increase the trading volume above average significantly. The highest and lowest hits by XRP in the last 24-hour period are $0.77 and $0.74, respectively.
Meme Coin Wars (Doge vs. Shiba)
You must have heard about the meme coin war, the battle between two dogs, Dogecoin and Shiba Inu, most popular among meme coins. Do you know, it’s not Bitcoin or Ethereum that attracted the most investors in the year 2021. Those are Shiba Inu and Dogecoin. The biggest question here arises: Which ultra-popular cryptocurrency turns out to be a better buy in 2022?
The first is Shiba Inu, a meme coin with a record-breaking rise of about 46,000,000 percent in 2021. This means that on January 1, 2021, those who had the luck, guts, and capacity to invest a little more than $2 in SHIB became millionaires. Shiba Inu’s historic rise has been fueled by its enhanced prominence. It’s one of the most popular cryptocurrencies in the United States, with more than 1.1 million investors owning SHIB tokens. Visibility and liquidity will rise when more crypto exchanges accept SHIB for listing. The debut of ShibaSwap, a decentralized exchange, in July was a positive trigger.
Then there’s Dogecoin, which surpassed Bitcoin and Ethereum as the most-searched digital currency in the United States last year. The Shiba Inu-inspired token was about 3,000 percent higher at the end of 2021. It’s not quite as good as Shiba Inu’s gains, but it’s still a bigger return than any other stock last year.
Elon Musk, the CEO of Tesla Motors, is arguably the most critical catalyst for Dogecoin in 2021 and beyond. Dogecoin is one of just three digital currencies owned by the world’s wealthiest individual. He’s no stranger to sending Shiba Inu-themed memes on Twitter, which serve as a makeshift sign for DOGE token buyers.
Elon Musk has tweeted that he will be working with Dogecoin’s creators to strengthen the blockchain-based network, in addition to being a strong backer of the project. For what it’s worth, project developers have already begun work on network modifications to lower transaction fees and make DOGE more competitive in the crypto market.
Increased adoption excites enthusiasts as well. Tesla just began accepting Dogecoin for a limited number of items, and other global corporations, such as AMC, have also given DOGE their blessing.
It’s just a matter of time to observe which meme coin turns out to be the best all over the cryptocurrency market this year, even if we talk about the most famous one over social media.
Elon Musk’s Todays Tweet happens to be in the correct place:
DOGE/USD Chart Analysis
After today’s tweet by Elon Musk, DOGE just flashed above the downward sloping line over the daily chart. You can imagine the influence of a single tweet over DOGE. There is no doubt why DOGE was one of the most searched crypto assets on social media last year.
DOGE is presently CMP at $0.11 and has dropped 1.14% of its market capitalization in the last 24-hour period. DOGE coin is looking to maintain recovery above the downward sloping line over the daily chart. Meanwhile, a consoling point for DOGE investors is that trading volume just shot up by 215.26% in the intraday trading session. Traders are getting involved after Elon’s tweet supporting Dogecoin.
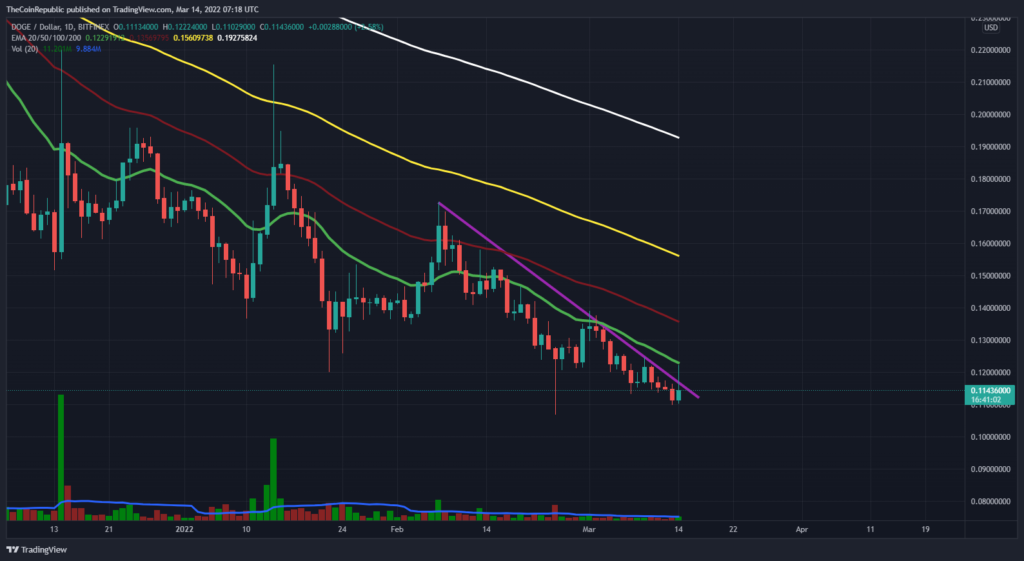
The DOGE Coin is bullish over the daily chart and preparing to maintain its recovery phase during the intraday trading session. However, volume change is not satisfactory over the chart and needs to grow above average for DOGE to escape from the neckline completely.
DOGE is under bulls control at this time, whereas bears may try to take charge before the end of the trading session. DOGE is currently below 20, 50, 100, and 200-days DMA and needs to recover. However, it’s approaching 20 SMA with some positive signs for DOGE investors.
SHIB/USD Chart Analysis
We have discussed the meme coin wars and moved on to the technical analysis of SHIB Coin. SHIB’s price is presently CMP at $0.00002197 and has lost upto 3.30% of its market capitalization in the last 24-hour period. However, in the intraday trading session, SHIB just gained 35.27% of its trading volume. SHIB investors are moving to let the coin escape from the descending triangle pattern over the daily chart.
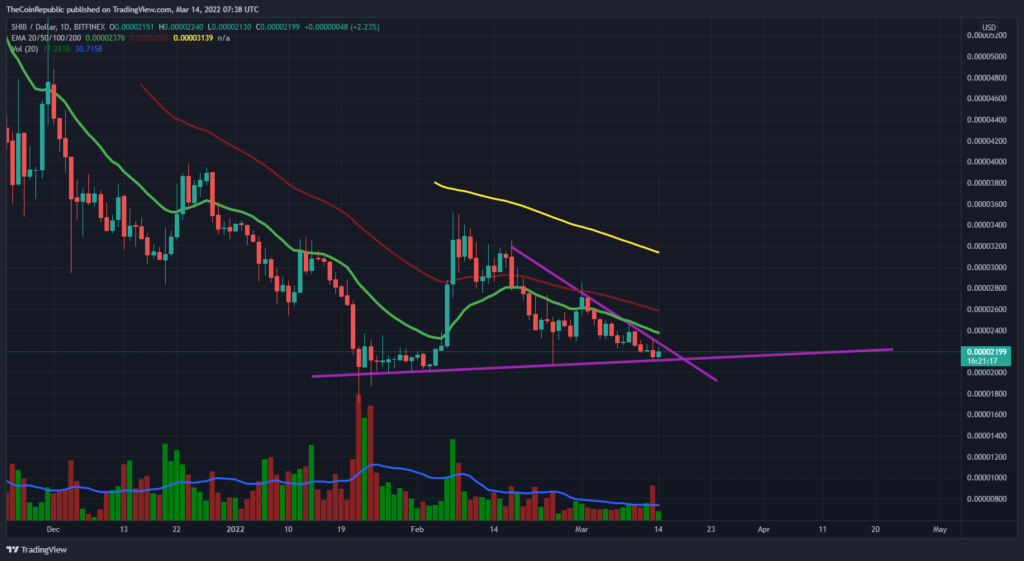
SHIB Coin aims for a 20, 50, and 100-days Daily Moving Average to overcome a long-term bearish momentum inside a descending triangle.
However, volume change is below average and needs to grow for the coin to escape from the descending triangle pattern.
SHIB seriously needs to attract more buyers to overcome the bearish hurdles on its way. Investors need to wait for any directional change until prompted over the chart.
The cryptocurrency market resembles the Phoenix bird I have mentioned earlier, and it will rise again from its ashes someday, just like a phoenix bird in Greek mythology does. Crypto investors need to sit back and trade with their utmost calmness in their hands.
Disclaimer
The views and opinions stated by the author, or any people named in this article, are for informational ideas only, and they do not establish the financial, investment, or other advice. Investing in or trading crypto assets comes with a risk of financial loss.

With a background in journalism, Ritika Sharma has worked with many reputed media firms focusing on general news such as politics and crime. She joined The Coin Republic as a reporter for crypto, and found a great passion for cryptocurrency, Web3, NFTs and other digital assets. She spends a lot of time researching and delving deeper into these concepts around the clock, and is a strong advocate for women in STEM.


