
 Home
Home News
News

- NEM coin gave a breakout of the descending wedge pattern last night and the asset price moved towards the crucial level of $1.0.
- Today XEM bulls are attempting to close the daily price candle above the 100-day moving average over the regular price graph.
- The XEM/BTC pair price is trading at 0.000002538 Satoshis, which is slightly down by 1.3%.
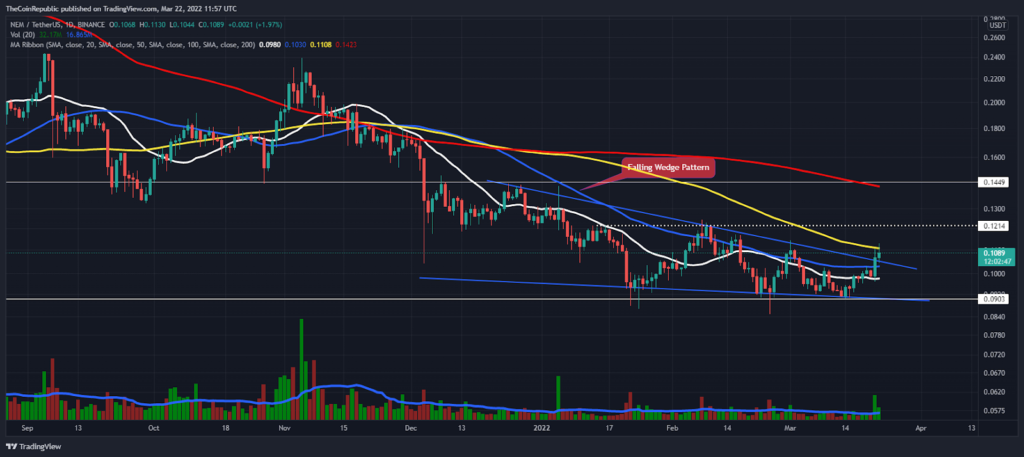
The price of NEM coin is drawing a falling pattern in terms of daily price chart since late December. However, the asset is slipping slowly from its all-time high peak and has lost nearly 94% of its cost in 52-weeks. Last night buyers swung into action and broke the descending wedge pattern (blue) with huge trading volume.

However, XEM Coin gained 20% of its value in 2-weeks after the bottom-low formation. At the time of writing, the NEM token is trading at $0.1093, which is slightly up by 3.45%. Above $1.0, the bulls are likely to continue to dominate the bullish trend. Thus, the XEM/BTC pair is trading at 0.000002538 Satoshis, which is 1.3% lower and the NEM and Ethereum pair is trading at 0.000003615 ETH.

The NEM coin is well above the 20 and 50-day moving averages, and in the intraday trading session XEM holders try to close the daily price candle above the 100-day moving average in the context of the daily price chart. Nevertheless, XEM Coin has increased the trading volume by 334% in the last 24 hours. Meanwhile, the volume to market capitalization ratio is 0.08832. During yesterday’s spike the volume bar showed highly liquidated sessions over the past 2 months.
How do technical indicators reveal the NEM trend?
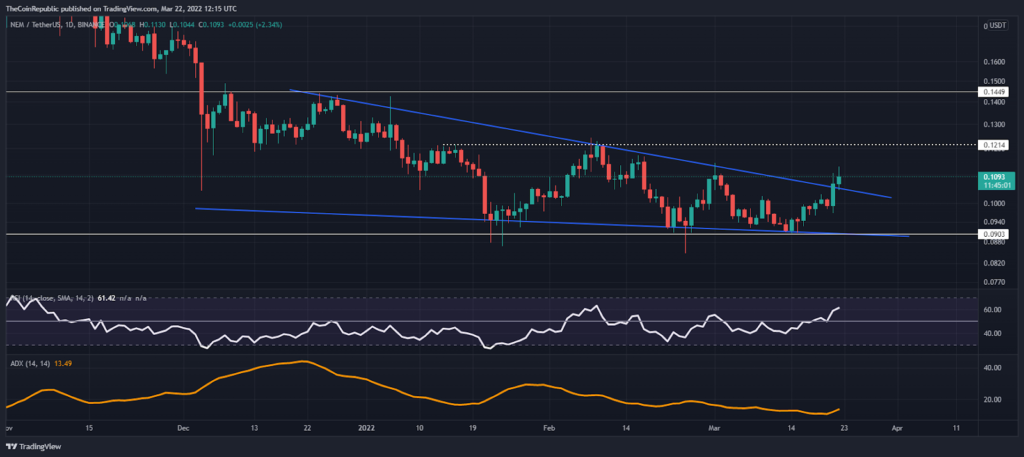
NEM investors are going to break the upcoming resistance level of $0.120. The RSI is at 61-points and giving strong signals to buyers in the daily price chart. Furthermore, the Average Directional Index is at 13-points, providing a sideways momentum signal for the NEM coin.
Conclusion
We can expect a bull run to the upcoming resistance level of $0.1210. At this level, the bulls might try to pull back and if the bulls push the NEM price above this level, the next bullish barrier will be at $0.1450.
Support level- $0.090 and $0.10
Resistance level- $0.1210 and $0.1450
Disclaimer
The views and opinions stated by the author, or any people named in this article, are for informational ideas only, and they do not establish financial, investment, or other advice. Investing in or trading crypto assets comes with a risk of financial loss.

With a background in journalism, Ritika Sharma has worked with many reputed media firms focusing on general news such as politics and crime. She joined The Coin Republic as a reporter for crypto, and found a great passion for cryptocurrency, Web3, NFTs and other digital assets. She spends a lot of time researching and delving deeper into these concepts around the clock, and is a strong advocate for women in STEM.


