
 Home
Home News
News
- The Graph token is making higher-highs and higher-lows formation on the 4-hours price chart.
- The GRT investors are going to the bullish hurdle near the bearish trendline on a 4-hours graph.
- The Graph token belonging to the bitcoin pair is bullish by 27.5% at 0.00000664 Satoshis.
Even in the near term, the Graph Token has finally relieved the selling pressure. GRT, on the other hand, witnessed many losses after breaking below the $0.5 resistance level. The recent carnage pushed the GRT below $0.39, reaching a 2022 low of $0.1180 on May 12.

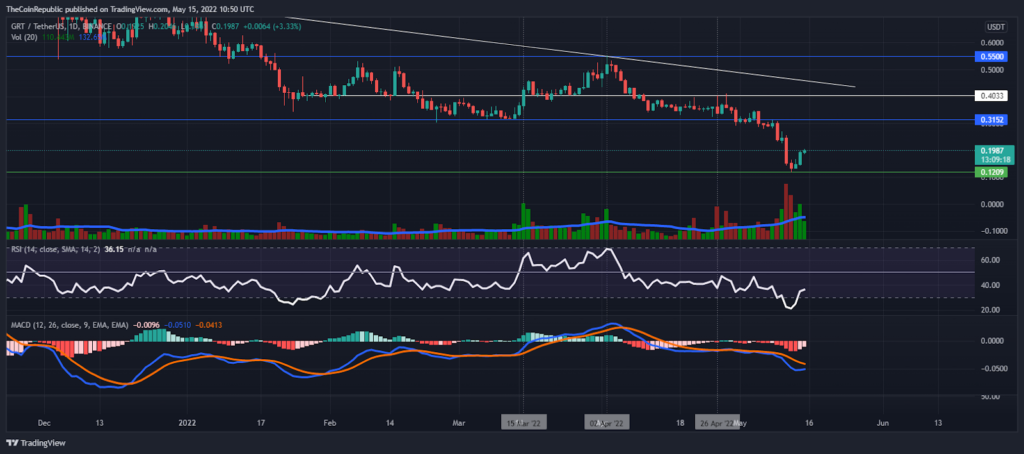
Despite the recovery, GRT holders are seeing a solid bearish weekend where they have lost around 33% of costs so far. Thus, this minor rally could propel GRT towards the most recent bullish barrier at $0.30.

Thus at the time of writing the GRT token is trading at the $0.1971 mark, with a 28.95% increase in its market cap over the past 24 hours to $1.3 billion according to CMC. Furthermore, the graph coin belonging to the bitcoin pair is up 27.5% on 0.0000664 satoshis.
In terms of the daily price graph, the RSI indicator is showing a slight correction as it is present at the 36-mark and is moving towards a semi-line. But on the other hand, MACD indicator is still going down in the negative zone and the moving line or signal line is going to overlap in the upcoming trading sessions.
Although the significant moving Avengers is well above the current price of GRT, yesterday’s trading volume indicates hidden activity by buyers as it is up by 95%.
GRT on 4-hours price chart
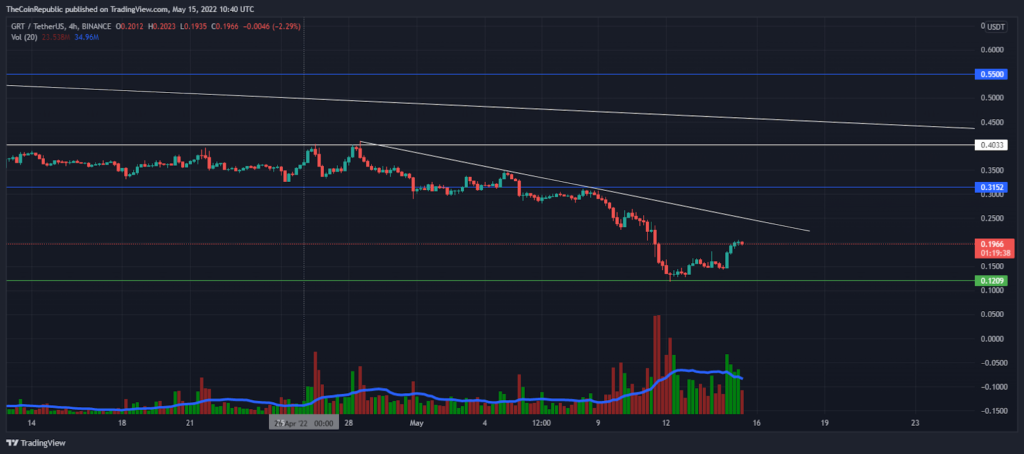
On the hourly price chart, price action is suggesting a descending trend line (white) over the past several days and the bulls are approaching this bullish barrier.
Cconclusion
To dominate the bullish trend, the bulls must push the price of Graph Token above a downward sloping trend line.
Support level – $0.12 and $0.10
Resistance level – $0.20 and $0.30
Disclaimer
The views and opinions stated by the author, or any people named in this article, are for informational ideas only, and they do not establish the financial, investment, or other advice. Investing in or trading crypto assets comes with a risk of financial loss.

Andrew is a blockchain developer who developed his interest in cryptocurrencies while pursuing his post-graduation major in blockchain development. He is a keen observer of details and shares his passion for writing, along with coding. His backend knowledge about blockchain helps him give a unique perspective to his writing skills, and a reliable craft at explaining the concepts such as blockchain programming, languages and token minting. He also frequently shares technical details and performance indicators of ICOs and IDOs.


