
 Home
Home News
News
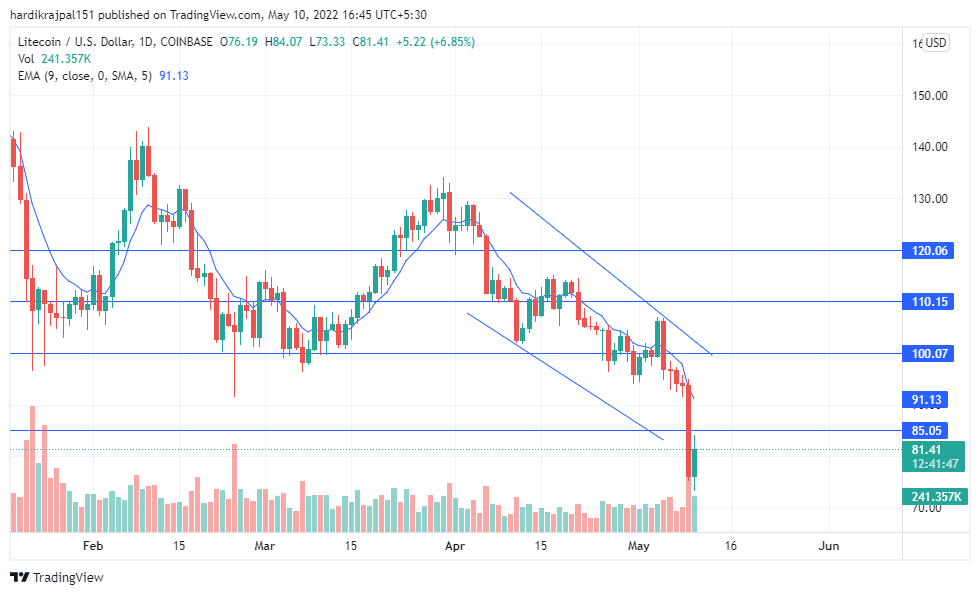
- LTC draws a falling wedge over the graph.
- The boom in the volume is sort of relief in the falling situation
- The LTC/BTC pair dropps 2.94%
Litecoin is a p2p cryptocurrency that was setup by a former google employee. LTC is a cryptocurrency that was designed to provide fast, secure and low cost payments and to be more efficient for daily use with the help of unique properties of blockchain technology. It shares many similarities with BTC and is also based on BTC original source code. Behind BTC, Litecoin is the second most popular cryptocurrency. Its main benefit comes from its speed and cost effectiveness.

LTC price is trading with a strong downtrend pattern over the daily chart. Since it’s all time high it entered in a falling wedge downtrend, but now it escaped the wedge pattern and jumped straight below the crucial support of $100. The current price for one LTC is $81.22 with a loss of 7.24% in market capitalization in the past 24 hrs, having a market cap of 569M which is also at a loss of 7.61%. While talking about the volume it is the only factor which is currently saving the LTC ecosystem from crashing, it has a boom of 133.10% over the intraday trading sessions. The ratio for volume and market cap has a value of 0.3191 and the LTC/BTC pair stands at a value of 0.00258 with a loss of 2.94% in its value.

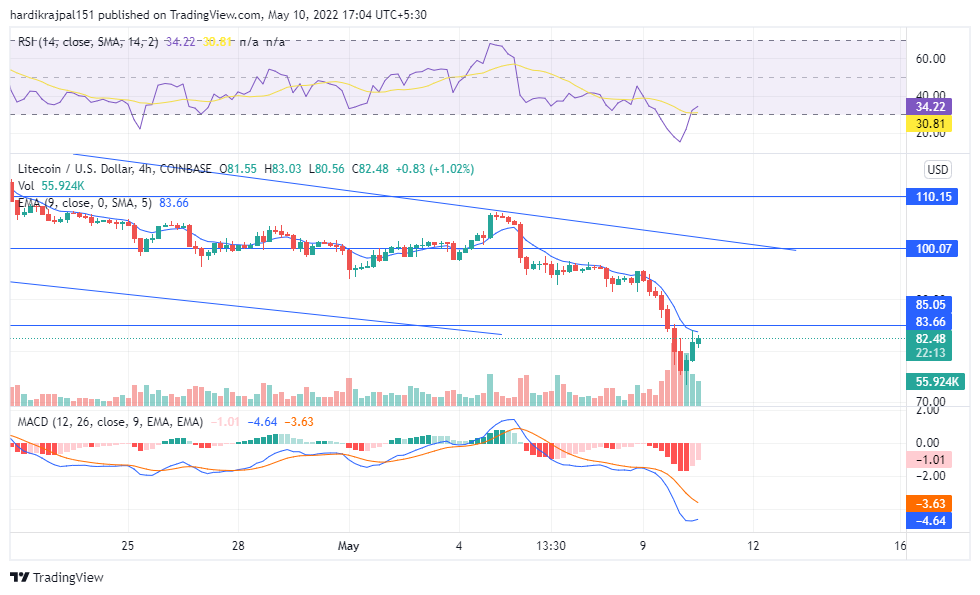
While analyzing the graph for short-term (4 hrs) the indicators are calling for a bullish movement to start as the MACD line is also making turn towards the positive direction as well as the relative strength index is has indicated a oversold region some time ago so maybe now the bulls are triggered and this may be the reason for the boom in the volume.
ALSO READ – SBI Holdings takes up a stake in BITpoint Japan
LTC strongly needs its bulls to get over this down trend. The value for the exponential moving average lies at $83.62 which is also confirming the down trend over the short medium and long-term graph.
Conclusion
Movementum is bearish, the MACD line is below the MACD signal line, while the value for relative strength index is below 45.
Technical level
Resistance: $110, $120.
Support: $100. $85.

Andrew is a blockchain developer who developed his interest in cryptocurrencies while pursuing his post-graduation major in blockchain development. He is a keen observer of details and shares his passion for writing, along with coding. His backend knowledge about blockchain helps him give a unique perspective to his writing skills, and a reliable craft at explaining the concepts such as blockchain programming, languages and token minting. He also frequently shares technical details and performance indicators of ICOs and IDOs.


