
 Home
Home News
News

- Bitcoin Cash price is trading inside a range bound area over the daily chart.
- The crypto asset is trading below 20, 50, 100 and 200-days Daily Moving Average.
- The pair of BCH/BTC is CMP at 0.006183 BTC with an intraday drop of 4.59%.
Over the course of a day, the price of Bitcoin Cash went through several unusual chart patterns. The crypto asset’s demise was initiated by a falling channel on the chart. Then BCH entered a consolidation period within a horizontal range, and the bulls attempted to accumulate, but were unable to sustain the breakout from the range-bound area, and the price began to decline again. Following peer selling pressure, BCH coin is now locked inside a horizontal range-bound area. Bulls must now gather in order to record the token’s successful breakout on the daily chart. Bears, on the other hand, may disrupt BCH’s rising momentum and force the coin to break down.

Bitcoin Cash price is presently CMP at $180 and has lost 5.92% of its market capitalization in the last 24-hour period. Trading volume has decreased by 2.00% in the intraday trading session. Bears are again coming forward and BCH may experience short selling during the intraday trading session. Volume to market cap ratio is 0.7936.

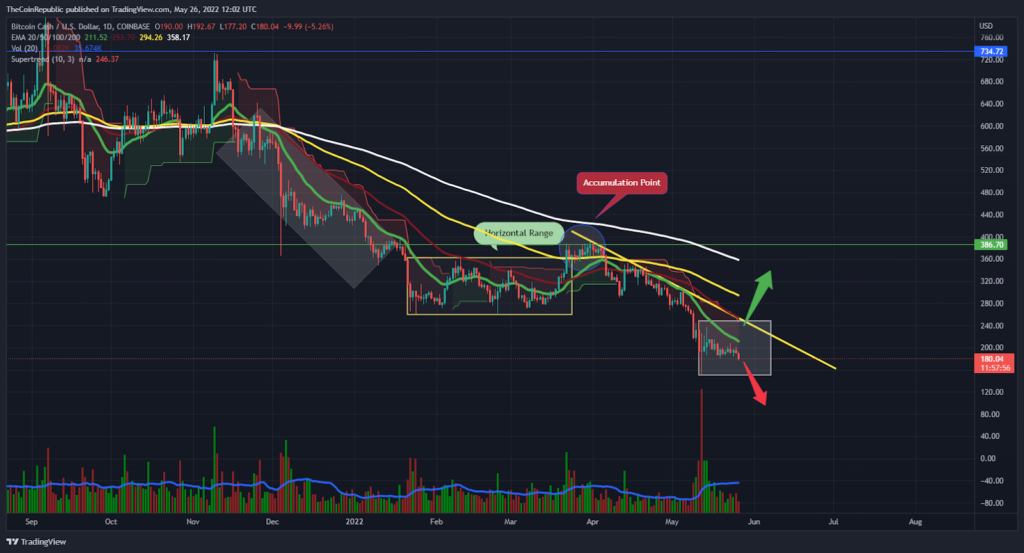
On the daily chart, the BCH token price has been trading within a horizontal range bound area. The token is attempting to break out from its consolidation phase, which necessitates it moving upwards with a strong rising momentum. With a successful breakout, BCH must try to register the token’s escape. However, the volume change is below average and must increase if BCH is to develop rising momentum.
Will BCH Escape or Get Caged?
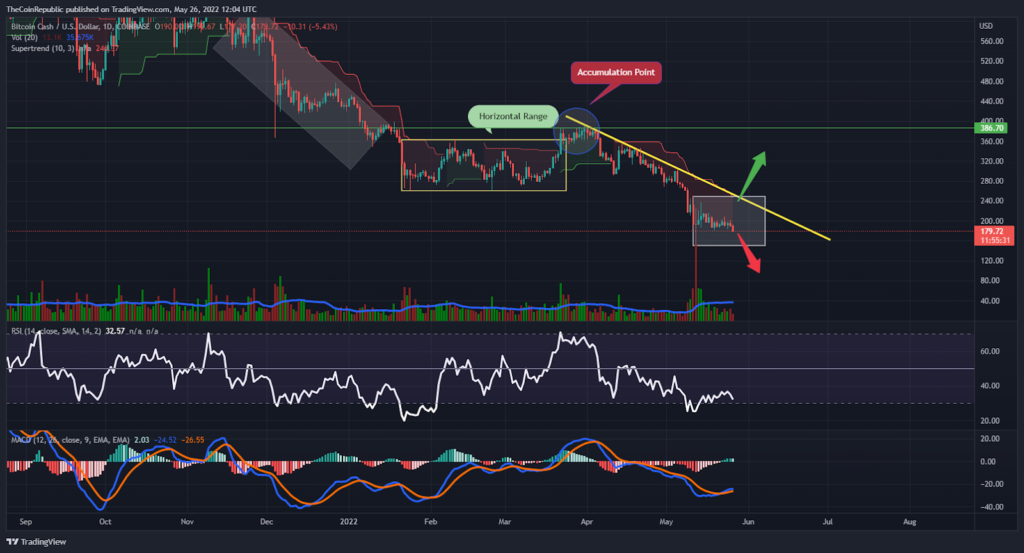
Bitcoin Cash price got stuck inside a consolidation phase and is now trading with sideways momentum over the daily chart. Technical Indicators suggest that the token is near oversold territory. Supertrend on the other hand, signifies the bearish rally of BCH over the daily chart.
Relative Strength index showcases that BCH coin is about to enter the oversold territory. MACD exhibits sideways momentum of BCH. The MACD line just crossed to signal line upwards without affecting the token’s momentum that much. Now the MACD line is again heading towards the signal line for a negative crossover.
To avoid consolidating and gain either uptrend or downtrend momentum on the daily chart, BCH investors should wait for any directional movement on the chart as soon as the token departs the range-bound area.
Conclusion
The BCH token price has been trading within a horizontal range bound area. The token is attempting to break out from its consolidation phase, which necessitates it moving upwards with a strong rising momentum. BCH investors should wait for any directional movement on the chart as soon as the token departs the range-bound area.
Technical Levels
Support Levels: $150
Resistance Levels: $200
Disclaimer
The views and opinions stated by the author, or any people named in this article, are for informational ideas only, and they do not establish the financial, investment, or other advice. Investing in or trading crypto assets comes with a risk of financial loss.

Nancy J. Allen is a crypto enthusiast, with a major in macroeconomics and minor in business statistics. She believes that cryptocurrencies inspire people to be their own banks, and step aside from traditional monetary exchange systems. She is also intrigued by blockchain technology and its functioning. She frequently researches, and posts content on the top altcoins, their theoretical working principles and technical price predictions.


