
 Home
Home News
News

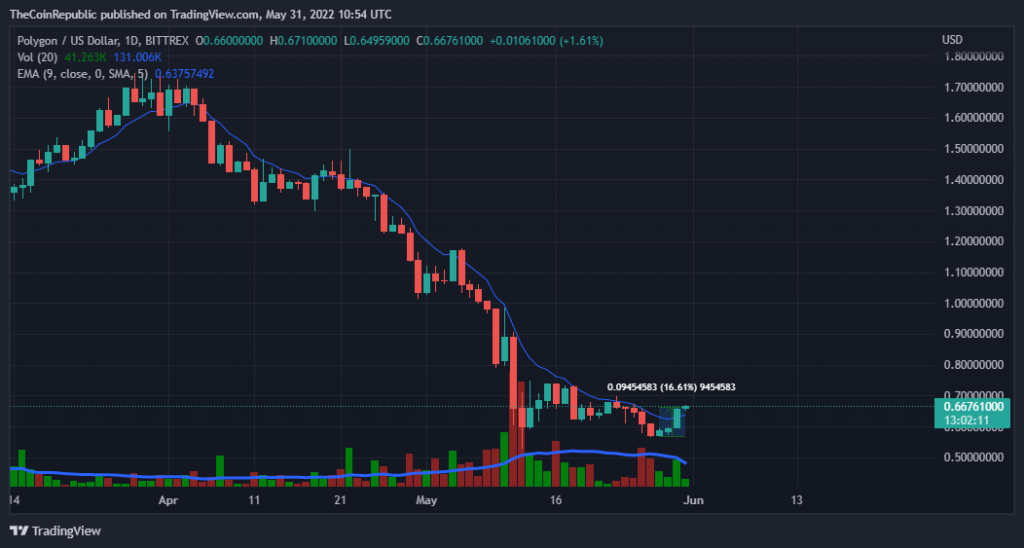
- Bulls are getting overpowered, the MATIC price surged to 16.6% in 4 days.
- The crypto asset is moving below the 20, 50, 100 and 200 daily moving average.
- The MATIC/BTC pair is at 0.00002111 BTC with a gain of 2.98%.
Polygon is the first well structured, easy to use platform for Ethereum scaling and infrastructure development. Its core component is Polygon SDK, a modular, flexible framework that supports building multiple types of applications. The project focuses on reducing the complexity of scalability and instant blockchain transactions.

The BTC price surged nearly 12% in 3 days, followed by the MATIC. The MATIC price surged 16.6% in 4 days. It looks like the bulls are putting effort all over the market these days. Though the bears will not sit quite easily, bulls have a window in between. They need to accumulate and continuously put in the efforts to make an escape from the bear market. The cryptocurrency market is very uncertain these days. Traders and investors are thinking and taking time before each step they take.

The current price for one MATIC is trading at $0.66 with a gain of 6.48% in its market capitalization in the last 24 hrs. The coin has a trading volume of 533 million with a gain of 6.03% in 24 hrs trading session and a market cap of 5.3 billion which is at a gain of 6.48%. The volume market cap ratio is 0.101.
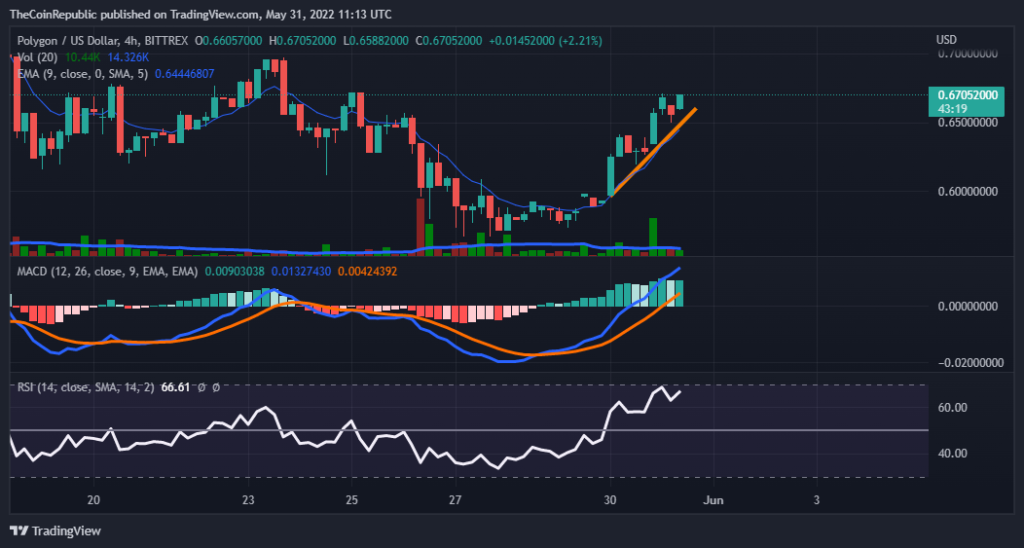
Short term Analysis
While analyzing the graph for a short term (4 hrs) we can observe a strong uptrend movement. The MATIC price is trading good above the exponential moving average. Here we can observe the battle of bulls and bears closely creating waves of uptrend, but we can conclude that the bulls are dominant currently. The price made a lower low of $0.62 in the 24 hrs trading session.
ALSO READ – Mercado Bitcoin Will Now Have Access To USDC On Stellar
The MACD indicator indicates a bullish movement further, as after the positive the cross the gap is getting broader, no sign of a negative coss can be seen. The signal looks quite strong this time. The relative strength index is close to the overbought region. The current RSI value is above 65.
Conclusion
The MATIC price surged 16.6% in 4 days. The bulls’ efforts are paying back. The price is trading at an uptrend across all time horizons. The bulls need to continue this effort to rescue the coin from the bearish market.
Technical levels
Resistance levels: $0.70 and $0.75
Support levels: $0.55 and $0.45
Disclaimer
The views and opinions stated by the author, or any people named in this article, are for informational ideas only, and they do not establish the financial, investment, or other advice. Investing in or trading crypto assets comes with a risk of financial loss.
Steve Anderson is an Australian crypto enthusiast. He is a specialist in management and trading for over 5 years. Steve has worked as a crypto trader, he loves learning about decentralisation, understanding the true potential of the blockchain.


