
 Home
Home News
News

- Cardano price is trading towards its escape from the falling parallel channel over the daily chart.
- The crypto asset has recovered above 20 SMA and is preparing for 50, 100 and 200-days Daily Moving Average.
- The pair of ADA/BTC is at 0.00001935 BTC with an intraday gain of 2.45%.
Cardano price is trying to escape the falling parallel channel over the daily chart. The token is rising towards the upper trendline over the daily chart. ADA bulls must accumulate themselves to register the token’s breakout. ADA investors need to wait until bulls sustain at the verge of the upper trendline. Cardano price must gather forces of bulls to sustain and register its breakout. However, due to the circumstances of the bear market, bears may try to pull the token back inside the falling pattern. As Bitcoin currently falters at the psychological level of $30000 and BTC holds the greatest dominance over the cryptocurrency market. As soon as BTC falls below $30000 level, other altcoins may also face some correction in their price.

Cardano price is presently CMP at $0.58 and has gained around 4.49% of its market capitalization in the last 24-hour period. However, trading volume has decreased by 25% in the intraday trading session. This shows that ADA is currently facing short-selling pressure, and it’s also increasing as the token is nearing the upper trendline. ADA bulls must accumulate themselves to save ADA from falling. Volume to market cap ratio is 0.05457.

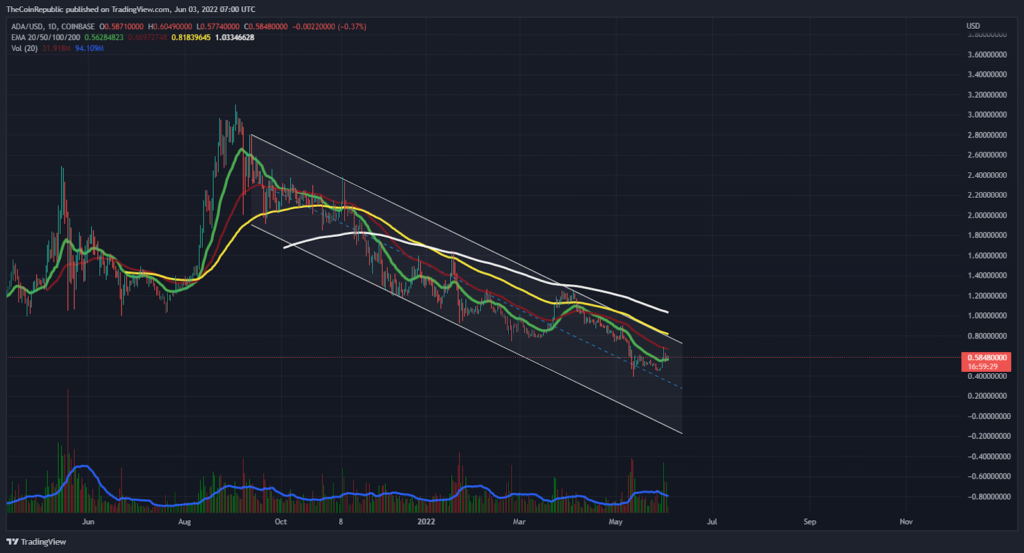
ADA coin price is trying to register its breakout over the daily chart. ADA has been declining through a descending parallel channel since September 2021. The crypto asset has been falling, and now it looks like ADA may finally register its breakout. However, ADA needs to strictly attract more buyers in order to break out of the descending parallel channel. Meanwhile, volume change can be seen below average and needs to grow for ADA to gain the uptrend momentum.
What do Technical Indicators Suggest about ADA?
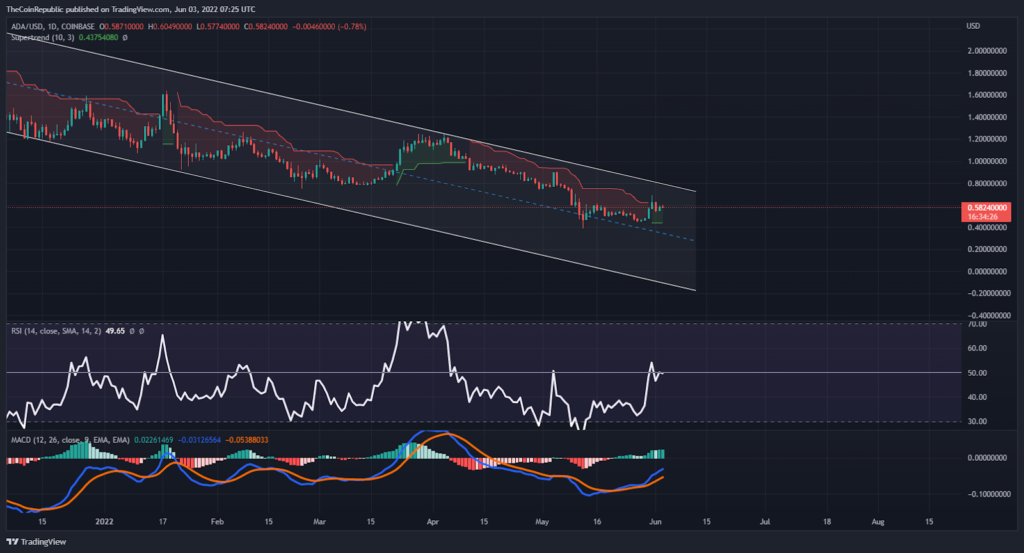
Cardano price is trading inside the descending parallel channel over the daily chart. The token is trying to gain support from bulls but falters at the current level. ADA strictly needs to attract more buyers in order to escape the descending parallel channel. ADA bull accumulation is much needed. Technical indicators suggest that ADA is trading at neutrality and getting up towards the overbought territory. Relative Strength Index showcases that ADA is at neutrality. ADA investors need to wait for any directional change over the daily chart. MACD exhibits the uptrend momentum of ADA coin. The MACD line is ahead of the signal line after a positive crossover.
Conclusion
Cardano price is trying to escape the falling parallel channel over the daily chart. The token is rising towards the upper trendline over the daily chart. ADA bulls must accumulate themselves to register the token’s breakout. Technical indicators suggest that ADA is trading at neutrality and getting up towards the overbought territory. ADA investors need to wait for any directional change over the daily chart.
Technical Levels
Support Level: $0.45
Resistance Level: $0.70
Disclaimer
The views and opinions stated by the author, or any people named in this article, are for informational ideas only, and they do not establish the financial, investment, or other advice. Investing in or trading crypto assets comes with a risk of financial loss.

Nancy J. Allen is a crypto enthusiast, with a major in macroeconomics and minor in business statistics. She believes that cryptocurrencies inspire people to be their own banks, and step aside from traditional monetary exchange systems. She is also intrigued by blockchain technology and its functioning. She frequently researches, and posts content on the top altcoins, their theoretical working principles and technical price predictions.


