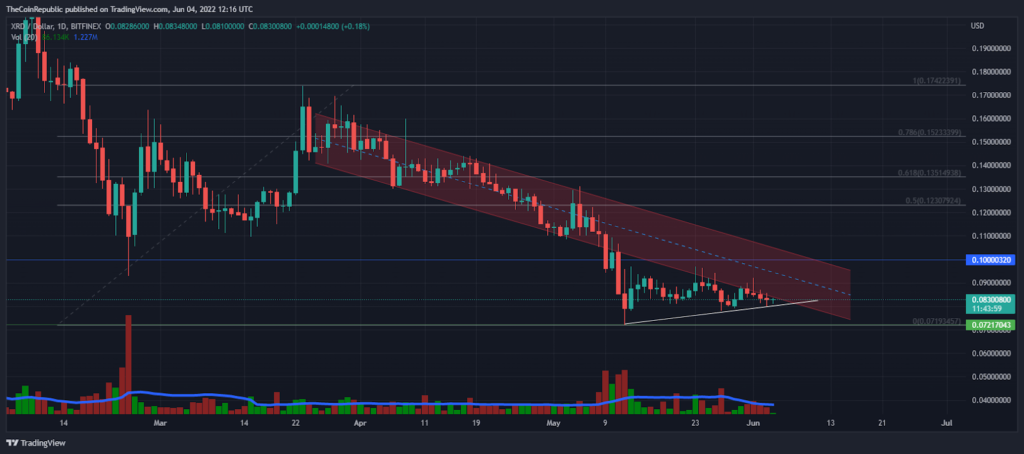
- Radix price action shows a high-low and low-high structure in the context of the daily price chart.
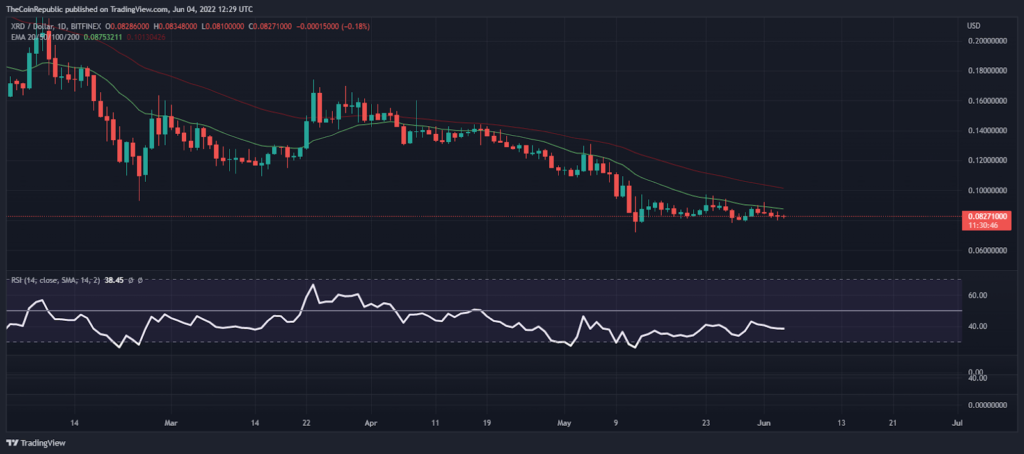
- The 20 EMA appears to be a recent bullish resistance on the daily price chart, meanwhile the 50 EMA is well above XRD price.
- The Bitcoin pair with Radix Coin is trading in the green zone at 0.000002872 satoshis, up 4.6%.
The Radix coin has been underperforming for over the past 6 months when the bulls were engrossed in sharp bullish rally’s celebration. During downtrend, many traders and investors have lost their money in the roller-coaster rise of XRD coin.
Many traders have been liquidated in each pump during downtrend. Meanwhile, the bears kept altcoin’s price into the falling parallel channel (red) over the daily price chart in April.
Radix shows a high-low and low-high structure in the context of the daily price chart after reversal from price action. Thus, the bulls are barely managing a cost above the bullish trend line (White), which could lead to a conceptual round level of the $0.10 mark.
Amid a sideways trend, Radix Coin was trading at the $0.0836 mark at the time of writing. But according to CMC data, buyers have gained around 1% in the last 24 hours. Moreover, the bitcoin pair with Radix Coin is trading in the green zone, up 4.6% at 0.000002872 satoshis.
The daily trading volume bar is showing extreme sideways movement for XRD until the price reclaims the $0.10 mark. However, traders saw a 13% increase in trading volume compared to the previous night.
Buyers approach bullish momentum
On the daily basis chart, the 20 EMA appears to be a recent bullish resistance on the daily price chart, meanwhile the 50 EMA is well above the XRD price. Similarly, the RSI indicator is showing sideways below the semi-line (50 points).
Conclusion
It appears that buyers are aggressive towards the Radix coin, albeit for short-term goals. Therefore, the bulls are barely managing a cost above the bullish trend line (White), which could lead to a conceptual round of levels at $0.10.
Support level – $0.07 and $0.05
Resistance level – $0.10 and $0.20
Disclaimer
The views and opinions stated by the author, or any people named in this article, are for informational ideas only, and they do not establish the financial, investment, or other advice. Investing in or trading crypto assets comes with a risk of financial loss.
ALSO READ: What’s in the Landmark Stablecoin Bill that Japan passed for investor protection?

Andrew is a blockchain developer who developed his interest in cryptocurrencies while pursuing his post-graduation major in blockchain development. He is a keen observer of details and shares his passion for writing, along with coding. His backend knowledge about blockchain helps him give a unique perspective to his writing skills, and a reliable craft at explaining the concepts such as blockchain programming, languages and token minting. He also frequently shares technical details and performance indicators of ICOs and IDOs.


 Home
Home News
News


