
 Home
Home News
News

•SHIB/USD is currently priced at $0.000011 and has decreased by 5.80% over the past day

•The trading volumes have increased by 52.67% over the past day

•The technical indicators suggest a hawkish outlook for the near term
Short Term View: Shiba Inu Coin falls further following 6% slump
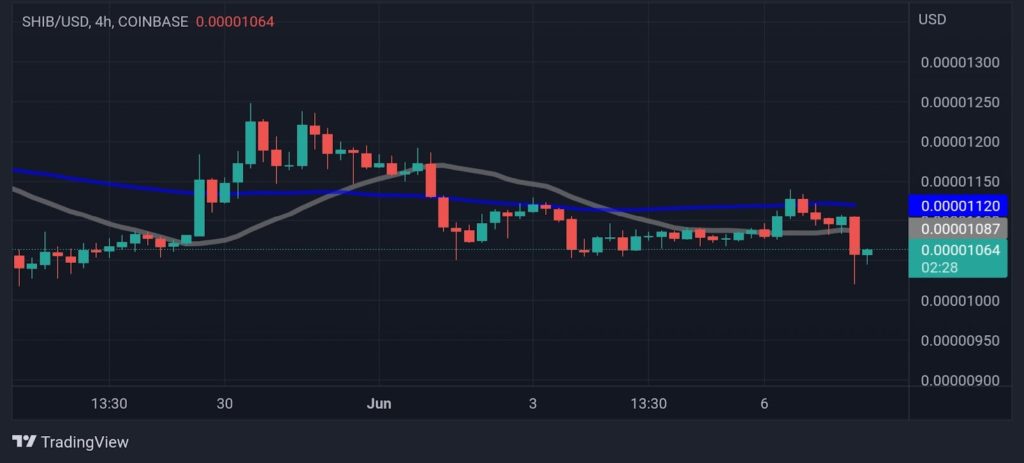
The Shiba Inu price today is $0.000011 USD with a 24-hour trading volume of $339,824,394 USD. Shiba Inu Coin is down 5.80% in the last 24 hours. The trading volumes have increased over the past day amid a rise in selling activity whereas the Volume to Market Cap Ratio stands at 0.0582 for the altcoin.
Shiba Inu Coin was predominantly in the red today, as it extended a recent losing streak that has sent prices down to multi-week lows.This latest drop seems to have taken prices below the support level of $0.000015 which may act as resistance in the near term. The asset may have a hard time violating this level, and therefore, the closing of candles above the $0.000020 level can trigger a bullish reversal. The bears will be aiming to plunge the prices further around the support level placed at $0.00000090 as the altcoin struggles to attract buyers at the current price levels. The bearish sentiment is captured by Shiba Inu Coin transacting below the 20,50 SMA on the four hour chart.
Long Term View for SHIB
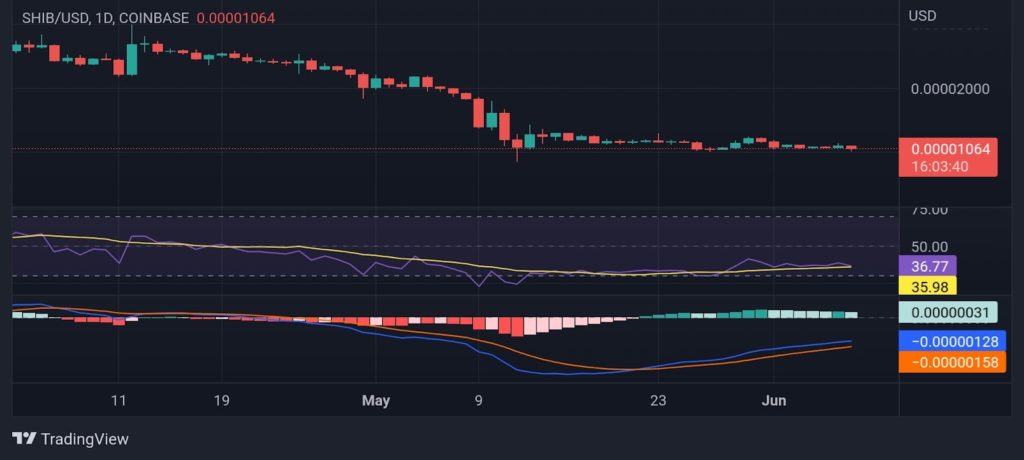
The technical indicators for Shiba Inu Coin are bearish for the near term as the MACD indicator shows the MACD and signal line transacting in the negative zone with the gap widening between the two. The decreasing size of the green histograms further accentuates the pain of the bulls. In addition to this, today’s drop of more than 5% has also led to a decline in relative strength, and the RSI line has fallen below the 14-day average line as it currently trades at 38.77.
Conclusion
While the Shiba Inu price declined on Tuesday, volume remained strong, which could indicate the presence of bulls. However, the on-chain metrics indicate that this is not the case and that the downtrend is not about to end anytime soon.
Support: $0.0000090-$0.0000075
Resistance: $0.000015-$0.000020
Disclaimer
The views and opinions stated by the author, or any people named in this article, are for informational ideas only, and they do not establish the financial, investment, or other advice. Investing in or trading crypto assets comes with a risk of financial loss.

Andrew is a blockchain developer who developed his interest in cryptocurrencies while pursuing his post-graduation major in blockchain development. He is a keen observer of details and shares his passion for writing, along with coding. His backend knowledge about blockchain helps him give a unique perspective to his writing skills, and a reliable craft at explaining the concepts such as blockchain programming, languages and token minting. He also frequently shares technical details and performance indicators of ICOs and IDOs.


