
 Home
Home News
News

- Bitcoin Price Slumps below $30000 due to the ongoing bear market, and the whole cryptocurrency market shedding blood red candles.
- BTC price is currently faltering below 20, 50, 100 and 200-days Daily Moving Average.
- Bitcoin price is still trading inside the horizontal range-bound area over the daily chart.
Bitcoin price has been consolidating inside a range of $28259 and $31450. BTC must gather support as it is trading with strong downtrend momentum over the daily price chart. The traditional cryptocurrency must gather support as it has closed 4 consecutive red candles over the daily price chart. Following this other altcoins also falter to gain support and they are also rallying bearishly over the chart. Bitcoin is said to be the greatest market dominator and it always proves itself. Bitcoin also needs to prove itself this time as small whales should accumulate themselves to save the traditional crypto token from falling below the downward trendline of the consolidation phase.

Cryptocurrency investors, as I constantly compare them to those with diamond hands, must stay strong in these difficult times. Those who don’t panic in bad times and don’t sell their stocks so quickly. So, if you want to maintain your assets, be the one with diamond hands. This is the market, and the market will undoubtedly rise, just as a calm and pious sun shines after a frightening and thunderstorming night.

Bitcoin price is presently CMP at $28877 and has lost 3.50% of its market capitalization in the last 24-hour period. However, trading volume has increased by 14% in the intraday trading session. This shows that buyers are still attracted towards the trade with bullish sentiments. Volume to market cap ratio is 0.0521.
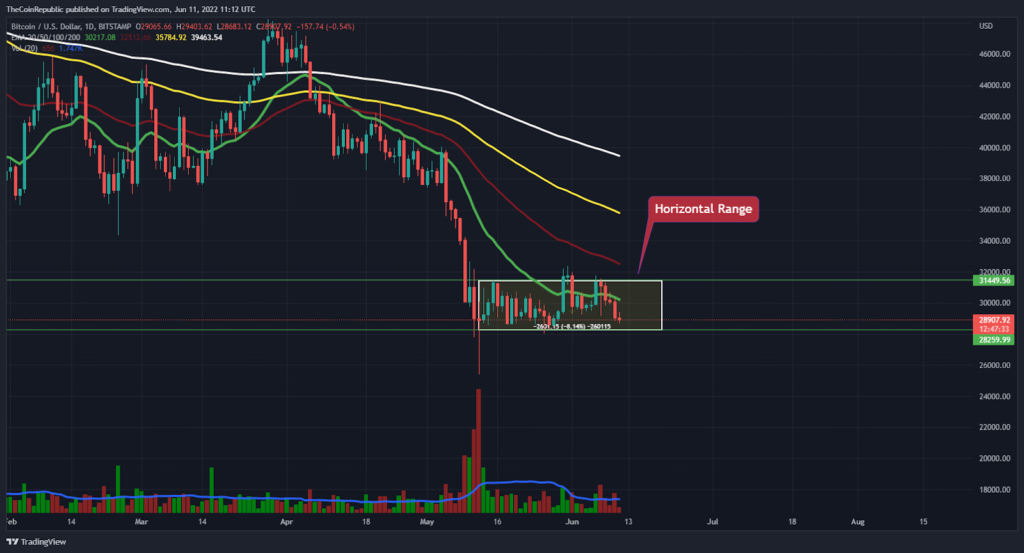
Bitcoin price has been falling over the daily chart. The traditional cryptocurrency must accumulate support from its whales to register its breakout from the horizontal range-bound area. However, BTC has been stuck inside that range since May 2022. Some analysts say that this is only the start of the bear market. Clouds of fear and horrific thunderstorms haunt the cryptocurrency investors and some analysts say that this bear market is temporary and it’s also another type of opportunity for cryptocurrency investors. Gradually falling volume below average shows the token’s bearish momentum. BTC price is currently faltering below 20, 50, 100 and 200-days Daily Moving Average.
Support on the lower end is at $28259 and resistance on the higher side is at $31450.
Total Liquidations
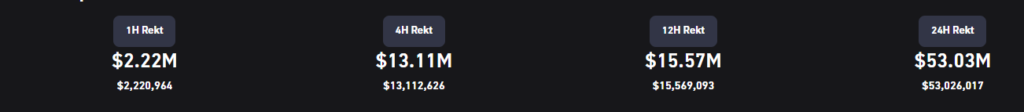
According to coinglass, a total of $53.03 million of Bitcoin was liquidated in the last 24 hours. In the last 12-hours, $15.57 million worth of BTCs has been liquidated, and in the last four hours, $13.11 million worth of BTCs has been liquidated. In comparison, $2.45 has been liquidated for about 2.5 million dollars in the last hour. This statistic indicates that this number of people left the bitcoin market empty-handed.
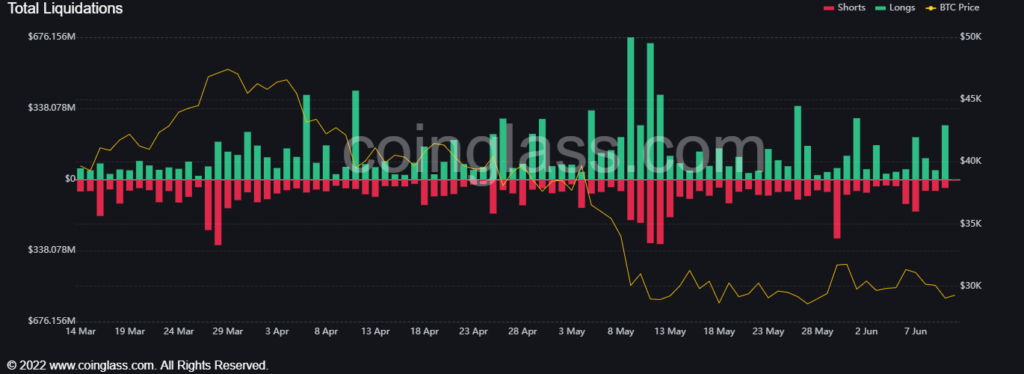
The graph above depicts total liquidations on several cryptocurrency exchanges while on short and long positions. For example, on Binance, the most well-known cryptocurrency exchange platform, a total of $595.14K has been liquidated while on long, and a total of $3.11 Million has been liquidated while on short.
Bitcoin Price: Technical Analysis
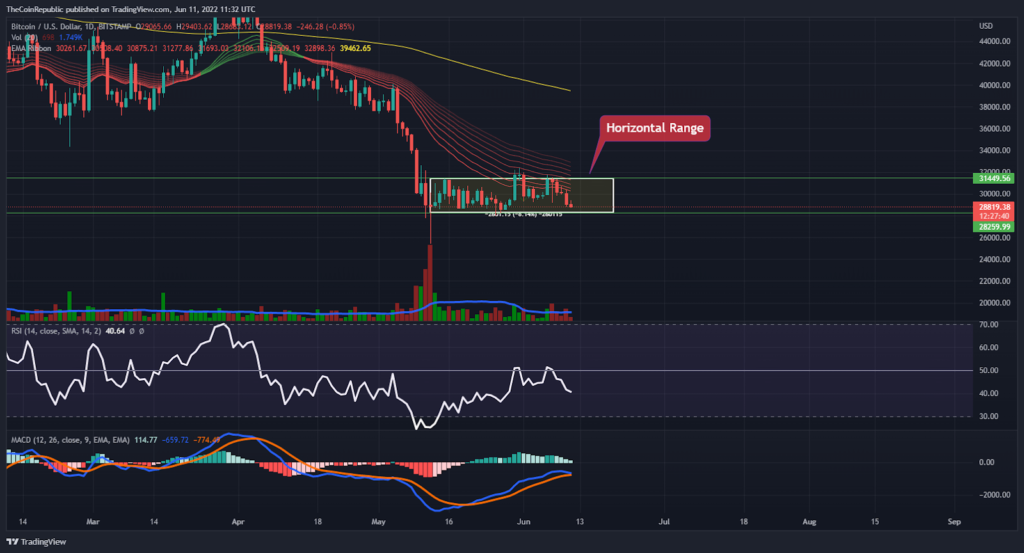
Bitcoin price is falling with a steady downtrend momentum over the daily price chart. The token has been falling inside the horizontal range-bound area towards the lower level. Small whales must get activated to save BTC from falling significantly and touch the $25000 lowest level. This bear market made each investor confused about the cryptocurrencies existence and they are thinking twice before entering the market. BTC whales on the other hand are sitting quietly at the moment to watch the show.
Technical indicators suggest the downtrend momentum of BTC. Moreover, EMA Ribbon showcases the bearish momentum of BTC as the price action is below EMA ribbons and it should cross upwards to register its recovery phase.
Relative Strength Index showcases the downtrend momentum of BTC. RSI is moving towards the oversold territory from neutrality.
MACD exhibits the bearish momentum of BTC as the MACD line is about to cross the signal line downwards, resulting in a negative crossover. This negative crossover signifies the token’s breakdown.
Conclusion
Bitcoin price has been consolidating inside a range of $28259 and $31450. BTC must gather support as it is trading with strong downtrend momentum over the daily price chart. The traditional cryptocurrency must gather support as it has closed 4 consecutive red candles over the daily price chart. Some analysts say that this is only the start of the bear market. Clouds of fear and horrific thunderstorms haunt the cryptocurrency investors and some analysts say that this bear market is temporary and it’s also another type of opportunity for cryptocurrency investors. Technical indicators suggest the downtrend momentum of BTC.
Technical Levels
Support Levels: $28259 and $25400
Resistance Levels: $30000 and $31450
Disclaimer
The views and opinions stated by the author, or any people named in this article, are for informational ideas only, and they do not establish the financial, investment, or other advice. Investing in or trading crypto assets comes with a risk of financial loss.

Nancy J. Allen is a crypto enthusiast, with a major in macroeconomics and minor in business statistics. She believes that cryptocurrencies inspire people to be their own banks, and step aside from traditional monetary exchange systems. She is also intrigued by blockchain technology and its functioning. She frequently researches, and posts content on the top altcoins, their theoretical working principles and technical price predictions.


