
 Home
Home News
News

- Ethereum price today noted a new yearly low at the $1545 mark; Now the question is, which is the next support level?
- ETH price action is seen inside a descending parallel channel on the daily price chart.
- Ethereum coin with bitcoin pair is trading at 0.05469 satoshis, down 7.4%.
ETH prices are falling continuously but still, long-term investors do not want to sell their ETH. Meanwhile, Ethereum has broken the key hedge level (at the $1700 mark) of Ethereum bulls.

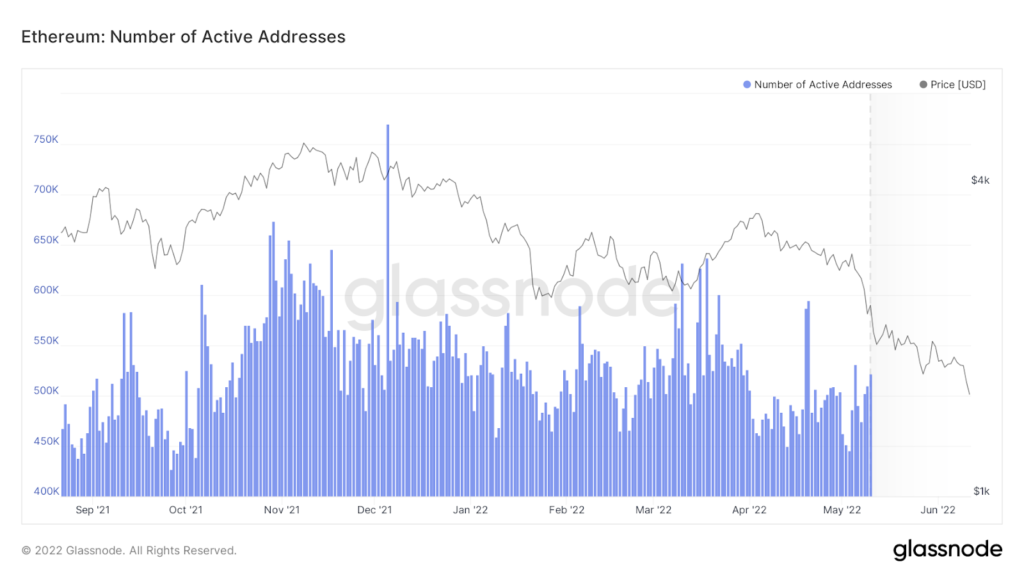
According to Glassnode data, the number of active addresses remains above $500K so far. Despite the sharp drop in the price of Ethereum, there has been no significant price movement in the ascending or descending addresses.

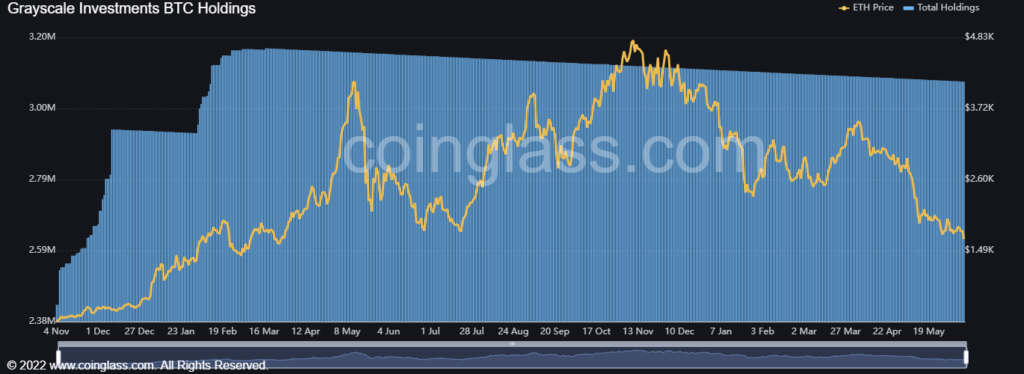
As per CoinGlass, the holding of Grayscale investors has reached $3.8 million since its peak of $3.18 million in March. So retail investors should not be afraid of scary liquidations. But still, a huge long unwinding may occur – if ETH price breaks below the $1500 area.
ETH on a daily price scale
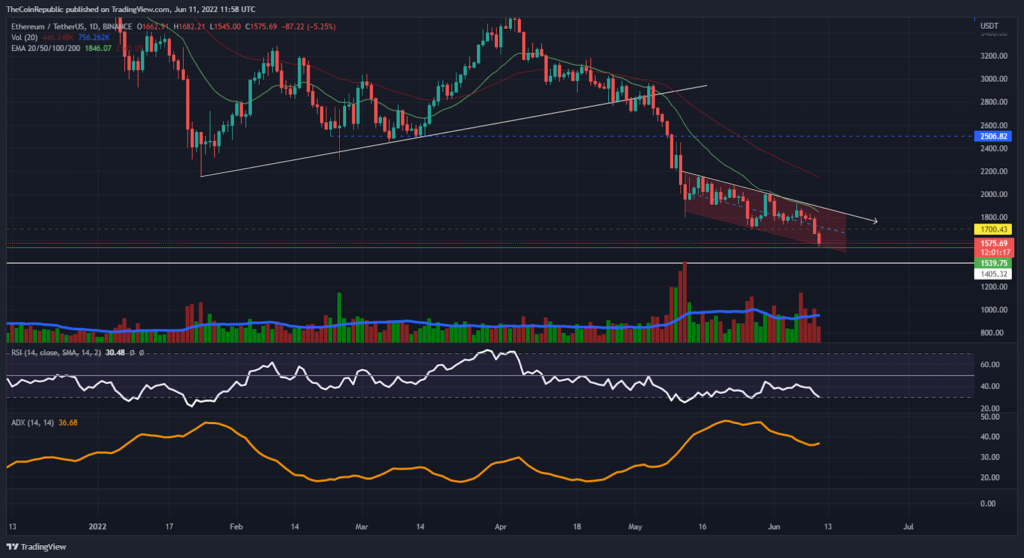
At the time of writing, Ethereum is trading with a solid bearish candle at the $1574 mark against the USDT pair in the intraday trading session. Recently the bulls witnessed the latest low of 2022 as well as the 52-week low at $1545 mark, which would act as a short-term support level if the daily price candle closes above this level.
There is no doubt that the bears dominate the ETH trend inside the descending parallel channel (red). Meanwhile, the market cap fell nearly 10.6% over the past 24 hours to hit below $200 billion.
Similar to the USDT pair, the Ethereum coin with the Bitcoin pair is trading down 7.4% at 0.05469 satoshis. However, the trading volume increased by 70% compared to the previous night. Increasing volume during a downtrend can be a sign of strong selling.
What do technical indicators say about ETH?
The 20 EMA appears to be a pivotal resistance level for the bulls on the daily price chart. Hence the bulls need to accumulate prices above this area as soon as possible.
Similarly, the daily RSI is about to move into the highly oversold zone. And the RSI may give a reversal signal after the weekly close.
According to the ADX indicator, a bearish trend remains strong.
Conclusion
Buyers will have to be patient for a bounce-back in Ethereum coin. But if the bears attempt a sell-off again, the $1500 mark could act as a short-term support level.
Support level – $1540 and $1400
Resistance level – $1700 and $2000
Disclaimer
The views and opinions stated by the author, or any people named in this article, are for informational ideas only, and they do not establish financial, investment, or other advice. Investing in or trading crypto assets comes with a risk of financial loss.

Nancy J. Allen is a crypto enthusiast, with a major in macroeconomics and minor in business statistics. She believes that cryptocurrencies inspire people to be their own banks, and step aside from traditional monetary exchange systems. She is also intrigued by blockchain technology and its functioning. She frequently researches, and posts content on the top altcoins, their theoretical working principles and technical price predictions.


