
 Home
Home News
News

- After the winds of recovery, the BCH price is now facing a downtrend across all time horizons. The momentum is greatly affected by the traditional cryptocurrency BTC.
- The crypto asset is moving below the 20, 50, 100, and 200 daily moving average.
- The BCH/BTC pair is at 0.005705 BTC with a loss of 1.77% in it.
Bitcoin Cash is a peer-to-peer electronic cash system that aims to become sound global money with fast payments, micro fees, privacy, and high transaction capacity (big blocks). As a permissionless, decentralized cryptocurrency, Bitcoin Cash requires no trusted third parties and no central bank.

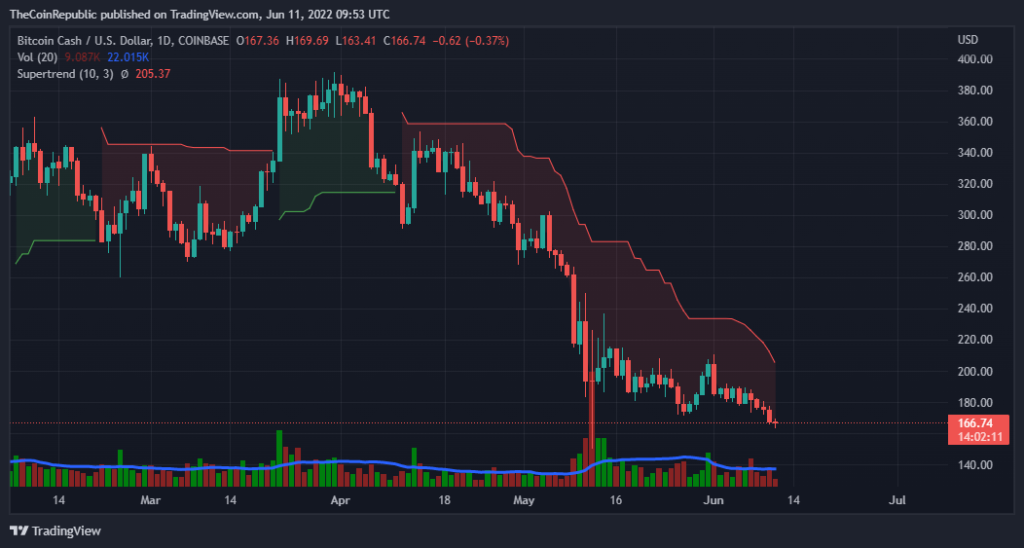
After recovery at the end of May 2022, the BCH price is now facing a continuous downtrend over the daily chart following the traditional cryptocurrency BTC. The bears are dominating the price and the whole cryptocurrency market is facing a hard time. The bulls should come to support as the market requires the bulls now. The price is falling continuously and one of the major reasons is the stunted growth of trading volume. To break the downtrend movement the coin has to attract more buyers to increase the buying volume.

The current price for one BCH coin is trading at $167.03, with a decrease of 4.45% in its market capitalization in the last 24 hrs. The coin has a trading volume of 2.1 billion, which is a loss of 0.14% in 24 hrs trading session, and a market cap of 3.1 billion. The volume market cap ratio is 0.6511
Short-term Analysis for BCH.
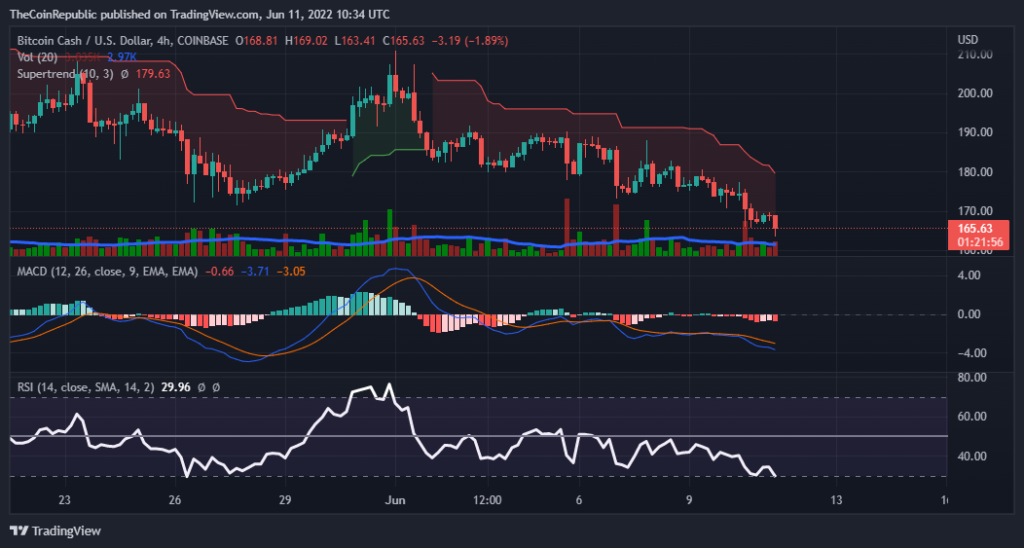
While analyzing the graph for a short term (4 hrs) we can observe the same downtrend as on the daily graph. The selling volume is increasing slowly and gradually causing the price to fall. The BCH is calling bulls to rescue the token. But the technical indicators indicate a bearish rally further.
The MACD line is moving below the MACD signal line after a negative crossover indicating a bearish movement. The histogram is bleeding red.
The relative strength index is just about to be oversold amid the selling pressure. The value for RSI is approximately equal to 30, and the price fell 14% in 5 days. The bulls need to come forward to support the ecosystem.
Conclusion
The BCH price is now facing a continuous downtrend over the daily and hourly chart following the traditional cryptocurrency BTC. The bears are dominating the price and the whole cryptocurrency market is facing a hard time. To break the downtrend movement the coin has to attract buyers. The technical indicators indicate a bearish rally further.
Technical levels
Resistance levels: $170 and $173
Support levels: $160 and $155
Disclaimer
The views and opinions stated by the author, or any people named in this article, are for informational ideas only, and they do not establish the financial, investment, or other advice. Investing in or trading crypto assets comes with a risk of financial loss.
ALSO READ: DOGE Price Analysis: Dogecoin in a spot of bother as bears gain ascendancy

Nancy J. Allen is a crypto enthusiast, with a major in macroeconomics and minor in business statistics. She believes that cryptocurrencies inspire people to be their own banks, and step aside from traditional monetary exchange systems. She is also intrigued by blockchain technology and its functioning. She frequently researches, and posts content on the top altcoins, their theoretical working principles and technical price predictions.


