
 Home
Home News
News

- The price coming from a downtrend, to enter in a sideways trend over the daily chart.
- The bulls need to overcome this sideways trend. The technical indicators seem to be useless here.
- The ZEC/BTC pair is at 0.003100 BTC with a gain of 0.46% in it.
Zcash is a decentralized cryptocurrency focused on privacy and anonymity. Zcash’s main advantage lies in its optional anonymity, which allows for a level of privacy unattainable with regular, pseudonymous cryptocurrencies like Bitcoin and Ethereum.

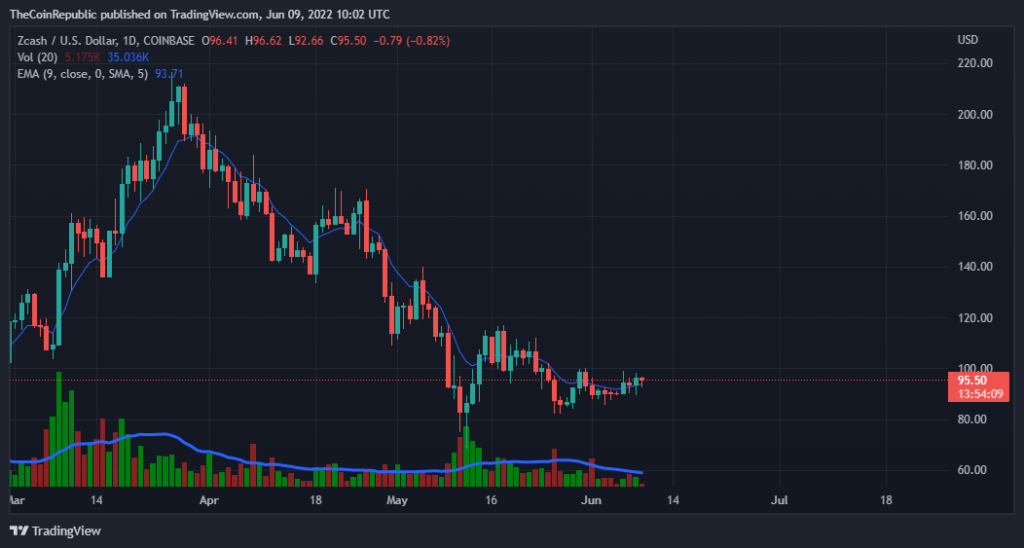
The ZEC coming from a long down trend is now moving stably over the daily chart. There is no directional move in the chart to predict the movement. Analysts say, more or less the price will enter a sideways trend for some days. This indicates that after the bearish dominance now the bulls have started to support the token which will result in a sideways trend. The bulls need to gather more support to break this trend. This potent coin with little support can cause wonders, but is currently facing some hard times.

The current price for one ZEC coin is trading at $95.2 with a loss of 2.83 in its market capitalization in the last 24 hrs. The coin has a volume of 104 million with a gain of 4.75% in the 24 hrs trading session and a market cap of 1.3 billion. The volume market cap ratio is 0.07919.
What do technical indicators suggest?
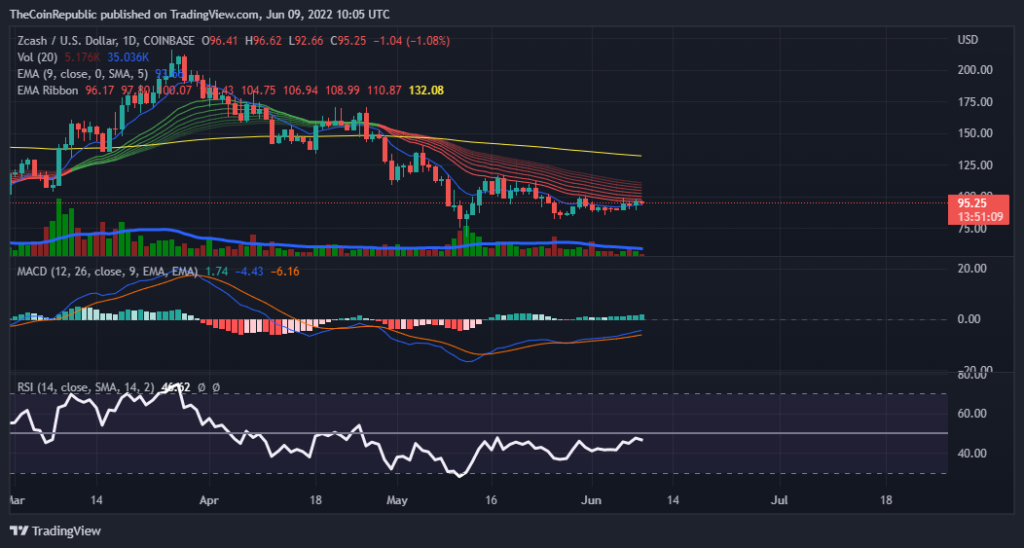
The price is still moving above the exponential moving average. While talking about the volume it gained just 4.75% and is moving below the average. The technical indicator like MACD is indicating a bullish movement as the MACD line is moving above the MACD signal line but this time the signal is not strong as the histograms are appearing very small.
ALSO READ – Is NFT Art Up To Scratch?
Whereas the relative strength index is not moving upwards which means the selling volume is still a bit dominating. The RSI value is above 45.
Conclusion
The ZEC coming from a long down trend is now moving stably over the daily chart. Analysts say, more or less the price will enter a sideways trend for some days. The investors are waiting for a directional move in the market. The technical indicators are of little help this time.
Technical levels
Resistance levels: $100 and $105
Support levels: $90 and $85
Disclaimer
The views and opinions stated by the author, or any people named in this article, are for informational ideas only, and they do not establish the financial, investment, or other advice. Investing in or trading crypto assets comes with a risk of financial loss.

Andrew is a blockchain developer who developed his interest in cryptocurrencies while pursuing his post-graduation major in blockchain development. He is a keen observer of details and shares his passion for writing, along with coding. His backend knowledge about blockchain helps him give a unique perspective to his writing skills, and a reliable craft at explaining the concepts such as blockchain programming, languages and token minting. He also frequently shares technical details and performance indicators of ICOs and IDOs.


