
 Home
Home News
News

- The CHZ price is trapped in a sideways trend. The token needs to accumulate buyers to break the resistance.
- Bulls need to take care of the coin as the technical indicators are indicating a bearish rally further.
- The CHZ/BTC pair is at 0.000004002 BTC with a loss of 2.41%.
Chiliz is the leading digital currency for sports and entertainment by the eponymous Malta-based FinTech provider. It operates the blockchain-based sports entertainment platform Socios, which enables users to participate in the governance of their favorite sports brands.

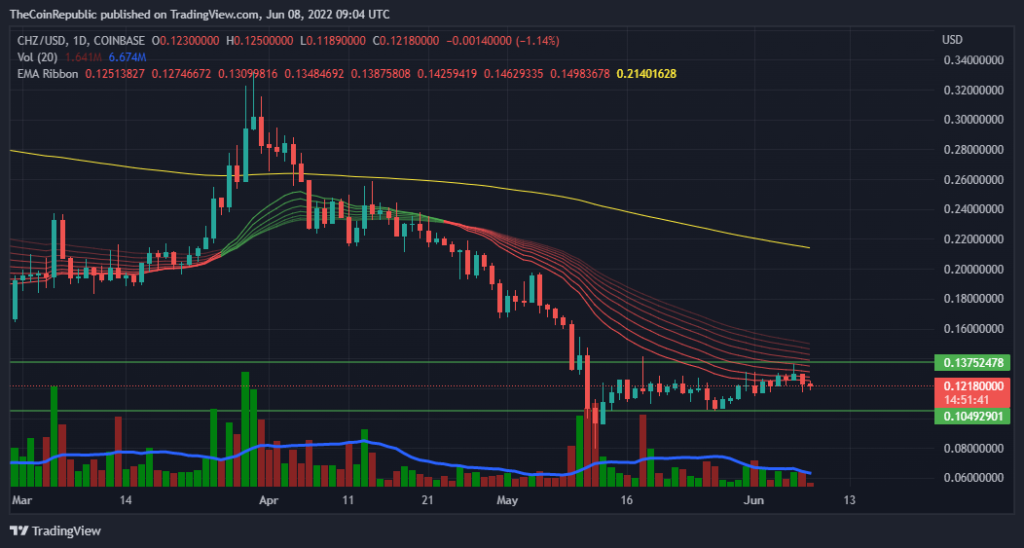
The CHZ price was facing a downtrend since the beginning of April 2022 and after this downtrend, the price is now stuck in a sideways channel of resistance and support at $0.13 and $0.10 respectively. The CHZ bulls have come forward and are giving tough fights resulting in the sideways trend. The token needs to gather more buyers to break this boundation. And bulls need to be consistent over the coin as analysts believe that the bears are in full preparation to make a breakdown.

The current price for one CHZ token is trading at $0.12 which is at a mere gain of 0.26% in its market capitalization in the last 24 hrs. The token has a volume of 69 billion with a loss of 9.27% in the 24 hrs trading session and a market cap of 731 million. The volume market cap ratio for CHZ is 0.09509.
Short-term Analysis for CHZ
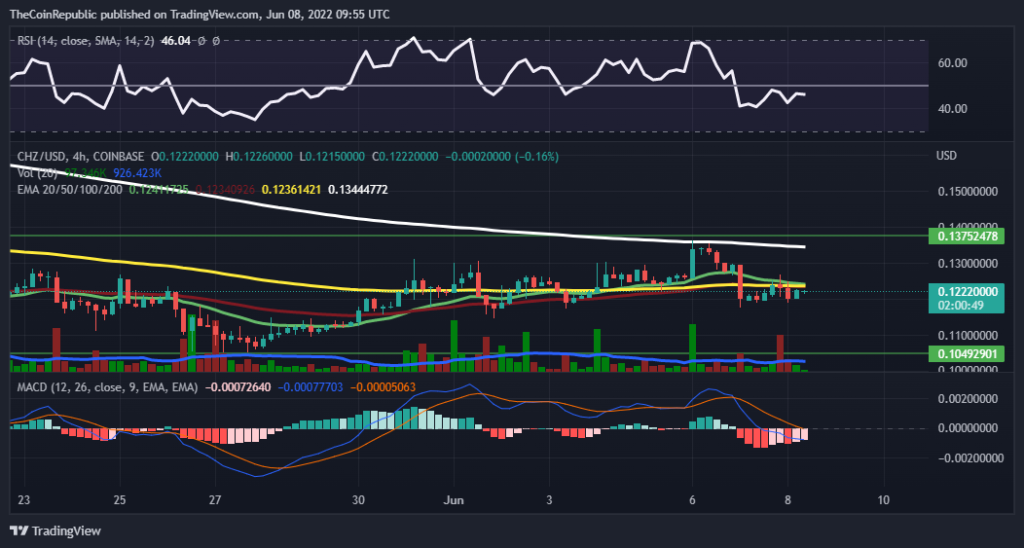
The same sideways trend can be observed over the short-term (4 hrs) graph. The bears look to be dominant as observing the Technical indicators.
The MACD indicator is indicating a bearish movement further as the MACD line is moving below the MACD signal line with a growth of red histograms in support. Along with the multiple EMA of 20, 50, 100, and 200 days which is just about to give a negative cross over the hourly graph.
The relative strength index is also indicating a bearish rally as the line is moving toward the lower region indicating the selling pressure over the token. The RSI value is nearly equal to 45 and still falling.
Conclusion
The price is currently stuck in a sideways channel of resistance and supports $0.13 and $0.10 respectively over the daily and hourly graph. The token needs to gather more buyers to break this boundation. The bulls need to take care of the token as the technical indicators are indicating a bearish movement further.
Disclaimer
The views and opinions stated by the author, or any people named in this article, are for informational ideas only, and they do not establish the financial, investment, or other advice. Investing in or trading crypto assets comes with a risk of financial loss.
ALSO READ: The Grand Collaboration Between Chainlink And Polkadot’s Moonbeam

Nancy J. Allen is a crypto enthusiast, with a major in macroeconomics and minor in business statistics. She believes that cryptocurrencies inspire people to be their own banks, and step aside from traditional monetary exchange systems. She is also intrigued by blockchain technology and its functioning. She frequently researches, and posts content on the top altcoins, their theoretical working principles and technical price predictions.


